Smart Gardening: Monitor Soil Moisture with the Tektelic Agriculture LoRaWAN® Sensor
Last modified on 11th April, 2024
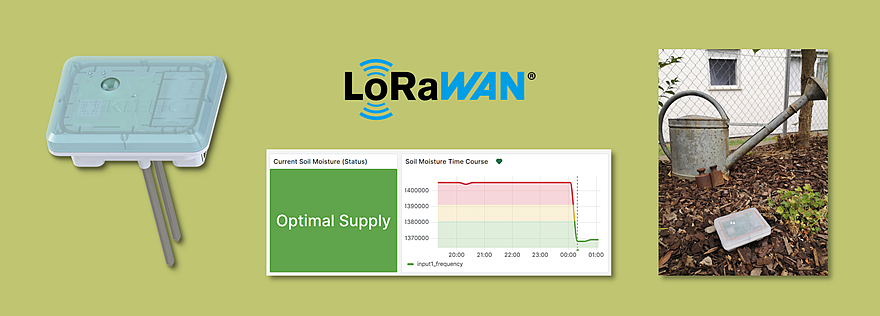
The article “Monitoring plants with IoT sensors and LoRaWAN®…” describes everything you need to monitor your plants with LoRaWAN® and what advantages this has. In my own garden, too, I have always watered our plants or the lawn rather on the spur of the moment. Since I wanted to change that and there is already LoRaWAN® reception here thanks to a ZENNER IoT GatewayPLUS, I put the whole thing into practice with the Tektelic Agriculture Soil Moisture Sensor, as announced in a recent post.
As a first step, I wanted to achieve the following three things:
- The soil moisture is measured
- The measurement data is visualized on a dashboard
- A notification is given when it is too dry
Measure Soil Moisture with Sensor
Before we start implementation, a few words and facts about the sensor used.
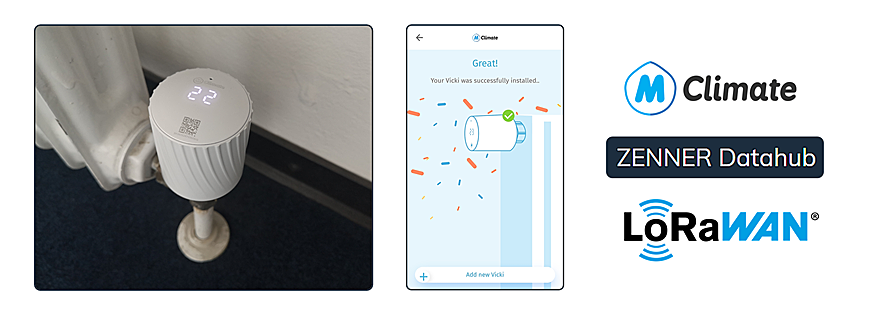
A brief portrait of the Tektelic Agriculture Sensor
The Class A LoRaWAN® sensor, powered by a C Cell LTC battery, is available in two different versions, in my case it is the “Soil Surface Mount Model (CLOVER)” with two integrated metal probes through which the measurement is made.
In the default configuration, the sensor behaves as follows, where the default measurement interval is exactly the same as the default transmission interval:
- Every 15 minutes transmission of:
- Input1_frequency = soil moisture in kilohertz (KHz), more on that later
- Input2_voltage = ground temperature in volts (V)
- Relative_humidity = Relative humidity percentage (%)
- Light_intensity = brightness or amount of light in lux (lux)
- ambient_temperature = ambient temperature in degrees Celsius (°C)
- Every 24 hours transmission of:
- Battery status → What is special here: With the help of a current sense amplifier (CSA) the sensor estimates both the remaining battery capacity and the remaining service life in days
I have not changed this configuration for the time being, but it can be changed at any time by sending downlinks via the ZENNER Datahub. Here are a few possible application examples:
- Shortening of the transmission interval in order to receive feedback more quickly as to whether enough water has been irrigated before it might become too much
- Disable unneeded parameters to save battery. According to the manufacturer, the battery life is at least 10 years for basic use, the transmission interval mentioned above and at room temperature
- Activation of threshold-based sending in order to receive data packets immediately if certain values are exceeded or falling below them
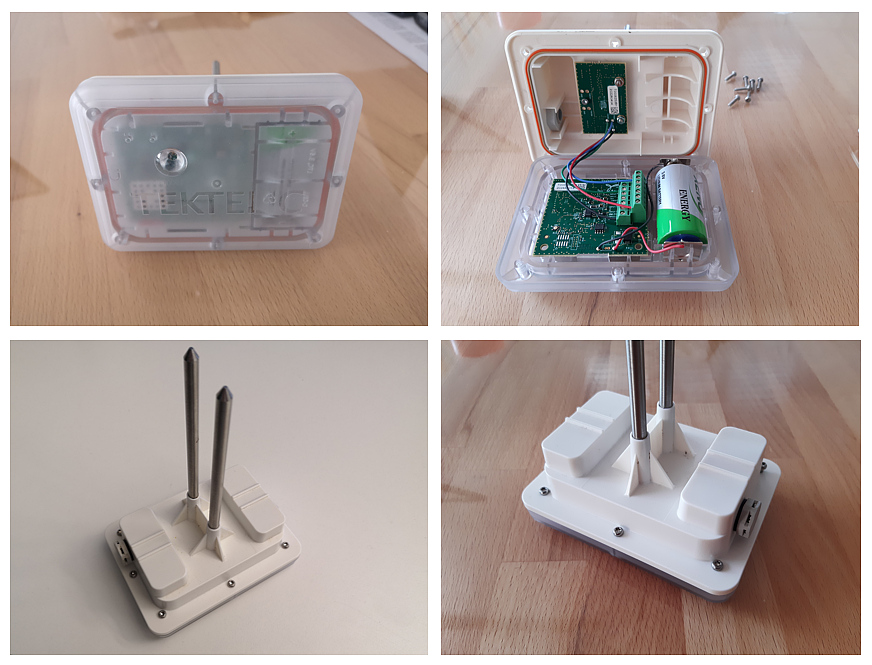
Mount and Commission the Sensor
The installation and commissioning of the sensor is really easy:
- Open the sensor housing with a torx screwdriver (the only thing that is a bit awkward as 8 screws are quite a few), insert the supplied battery and close the housing again . Important : I haven’t had any problems with this, but you should make sure that the silicone seal sits cleanly in the housing when you close it, so that the sensor is really tight.
- Simply insert the sensor with the two metal probes into the soil to be monitored.
- Briefly hold the supplied magnet against the integrated reed switch (see magnet symbol on the housing) to activate the sensor and trigger the join process via OTAA. During booting and connection establishment, the LED flashes and lights up green at the end if the join process was successful.
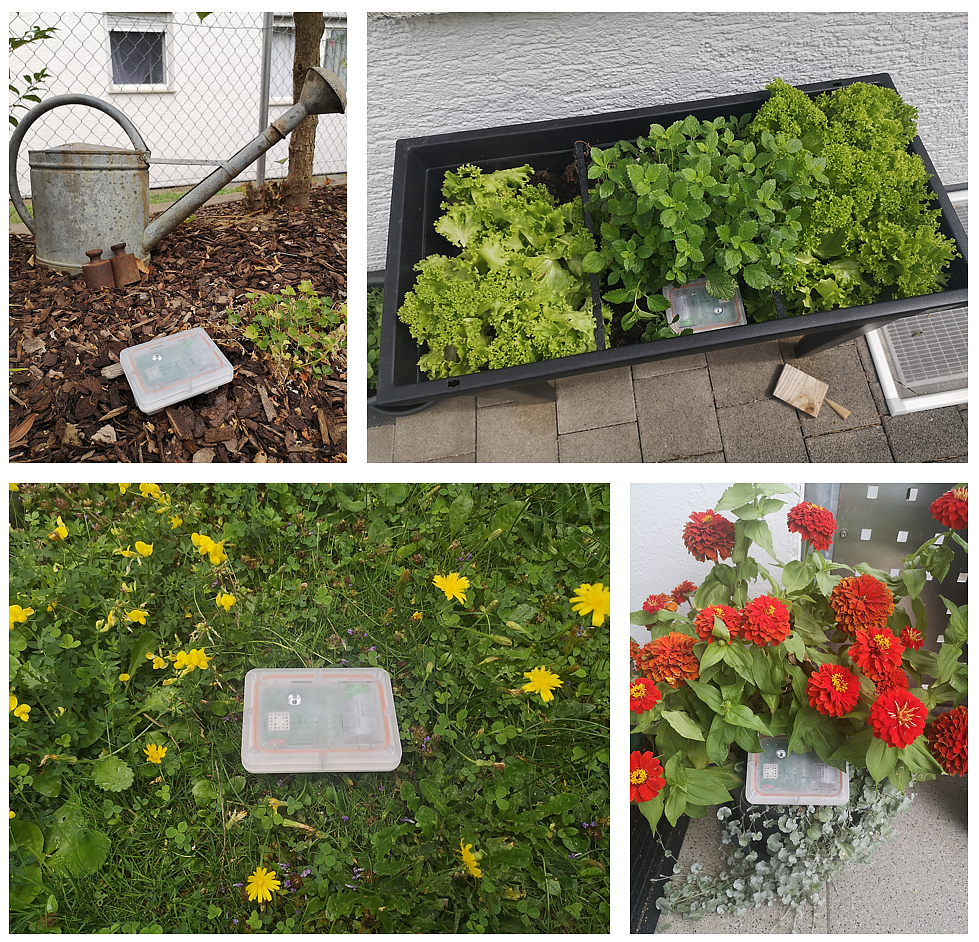
Here are a few photos of the installed sensor at various installation points in the garden:
Visualize Measurement Data on Dashboard
As far as the visualization of the recorded measurement data in a dashboard is concerned, the first idea was to simply add the sensor to one of my B.One Gallery building groups. Unfortunately, since there is currently no parser for this device, I used the open source tool Grafana in this case.
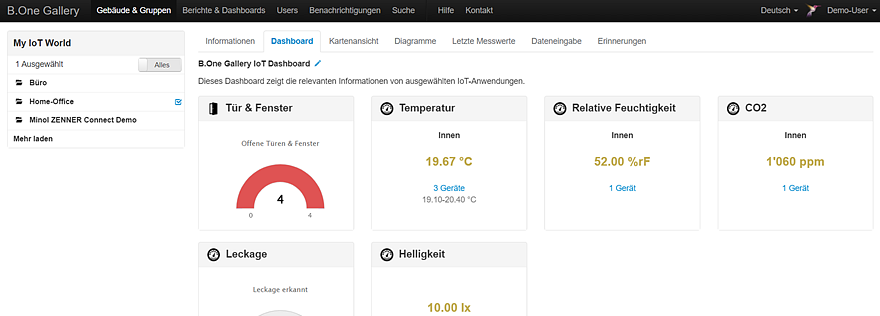
Here is a view of my garden dashboard that I have created so far:
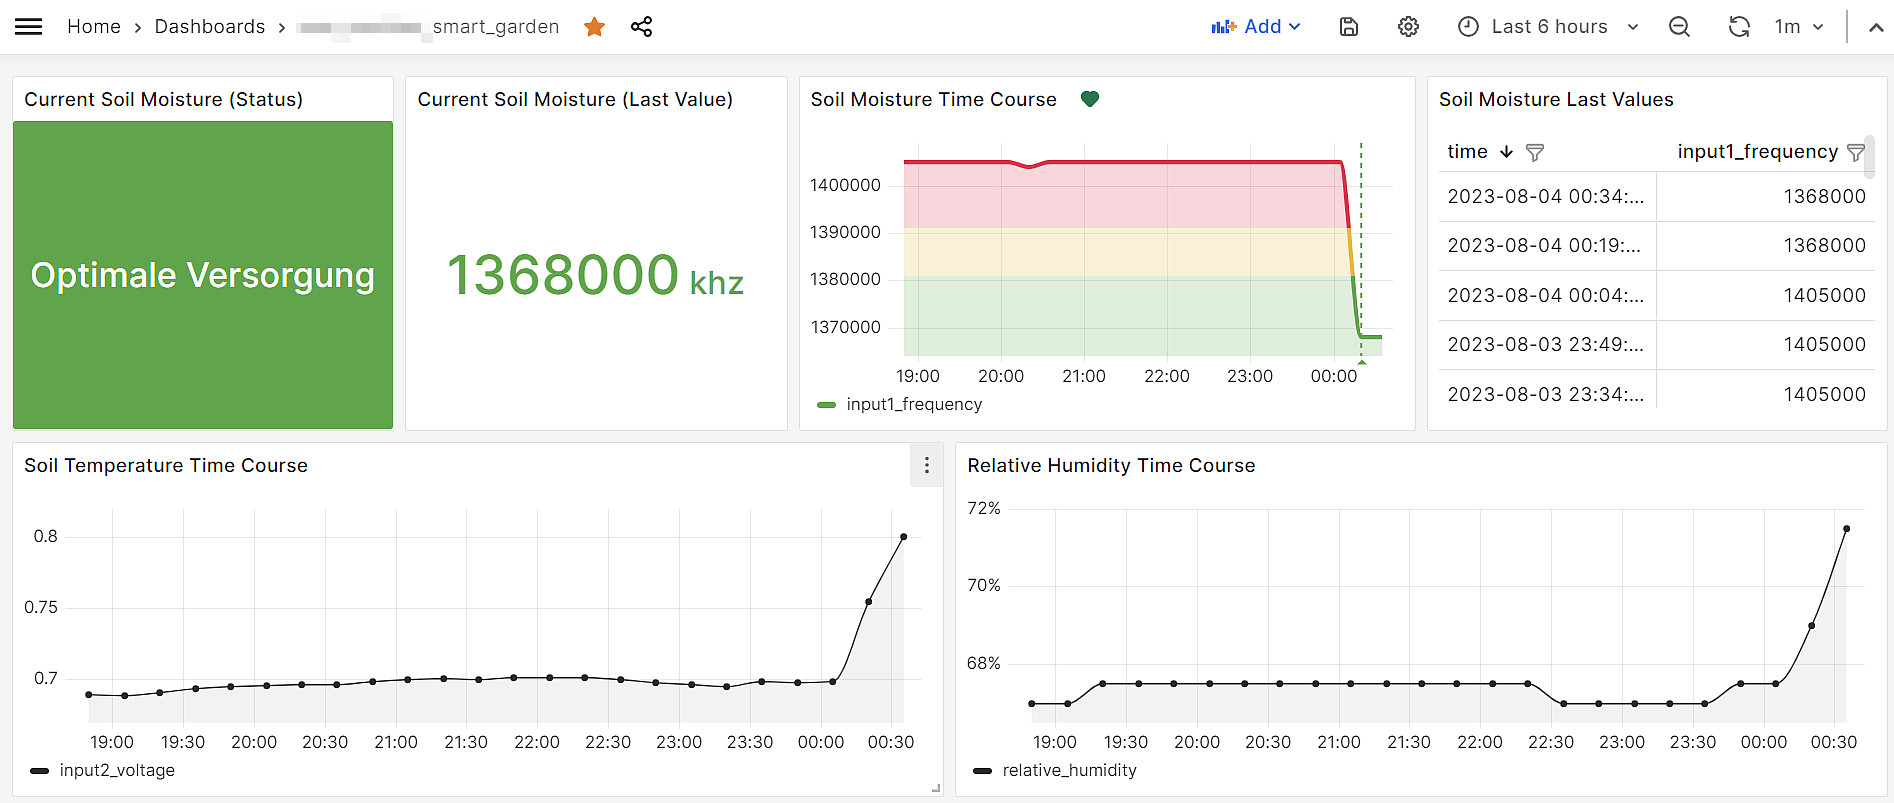
As you can see, my dashboard so far contains:
- A panel with the current status of the soil moisture = indication of whether it is currently too low, too high, still okay or good. Based on the conversion table in the payload description and a table for plant development, I have stored the following threshold values for this:
- from 1356000 kHz → optimal supply (green)
- from 1381000 kHz → still sufficient supply (yellow)
- from 1391000 kHz → undersupply (red)
- Base, ie everything< 1356000 → oversupply (blue)
- A panel with the current or last measured soil moisture value
- A panel showing the course of soil moisture over time
- A panel with the last measured values in tabular form
- One panel each with the other parameters mentioned above over time
This dashboard can be expanded at any time as you wish. There are hardly any limits to your own imagination. How exactly you create your own dashboard can be found in the Grafana documentation. Weitere hilfreiche Artikel zum Tool findet ihr darüber hinaus auch in der Blogkategorie Grafana. So zum Beispiel ein Howto, Grafana lokal installieren könnt.
ZENNER Datahub and Postgres database as Data Source
Since my sensor is integrated into the ZENNER Connect LoRaWAN® network, the ZENNER Datahub serves as a database. The data recorded by the sensors is transmitted via http POST forwarding to a postgres database in the background, where it is accessed by Grafana for display on the dashboard. How you can connect a database to Grafana is shown in the blog post “Grafana Howto: Connect a database as a data source“.
Set up Drought Notification
In order not to always have to look proactively at the created dashboard, as mentioned at the beginning, I wanted to receive a notification when it gets too dry. I found out how to set this up from the article “Grafana Howto: Setting up alerts using Telegram as an example“.
Here is an example of a notification when 1391000 kHz is exceeded (= undersupply):
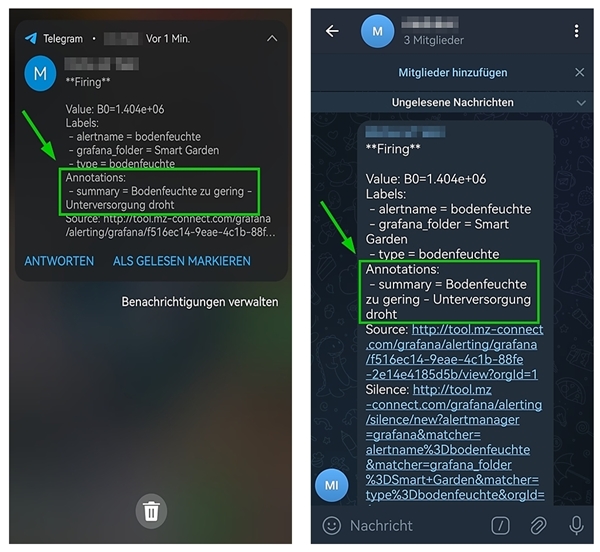
As you can see, the received notification doesn’t look very good yet, but it is sent and serves its purpose for now. What I’m also trying to figure out is how to set it to send another notification when the soil moisture has returned to normal.
Conclusion and Outlook
We have now seen an example of how the use case of soil moisture monitoring can be implemented with the LoRaWAN®-based Tektelic Agriculture Soil Moisture Sensor (CLOVER), the ZENNER Datahub and a tool such as Grafana. Of course, this can be transferred to many other areas of application. My Summary Conclusion:
- The Tektelic Agriculture Sensor is quick and easy to install and activate.
- The values are reliably transmitted by the sensor.
- The sensor makes a good, very robust impression and the form factor is suitable for many applications and mounting locations, but not for e.g. small flower pots.
- The sensor can already be used in the standard configuration, but also offers many configuration options. However, the configuration is a bit awkward, as there is unfortunately no downlink/payload generator.
- Setting up a Grafana dashboard and (Telegram) notifications is here and there a bit more complex and, in my opinion, a bit “tricky”, at least if you haven’t worked with the tool that much before. On the other hand, you have many individual design options. However, an integration into the B.One Gallery would be the much simpler option.
Last but not least a small Outlook: Capturing soil moisture is a great thing, but in the next step I want to expand the whole thing and after a notification about soil that is too dry at the push of a button remote control the faucet in the garden, for example to make it easier to water the lawn using the sprinkler system or to turn off the water from a distance for the children if they overdo it again. Hopefully more on that soon in another post 🙂

Responses