Trick or Teat with LoRaWAN® – Halloween House Entrance Monitoring
Last modified on 11th April, 2024
It was Halloween again recently and of course it was time for “trick or treat” this time too. Since we moved around the houses again this year with the children and didn’t want them to be woken up later by the constant ringing of the front door, I implemented a small house entrance monitoring using LoRaWAN®-based IoT sensors from the office. As announced, you can now finally find out in this article what the whole thing looked like in detail and what insights I was able to draw from it.
Goals of my Halloween House Entrance Monitoring
Before I started implementing it, I thought about what my house entrance monitoring should actually contain. This was primarily:
Old Apple Crate as a Base
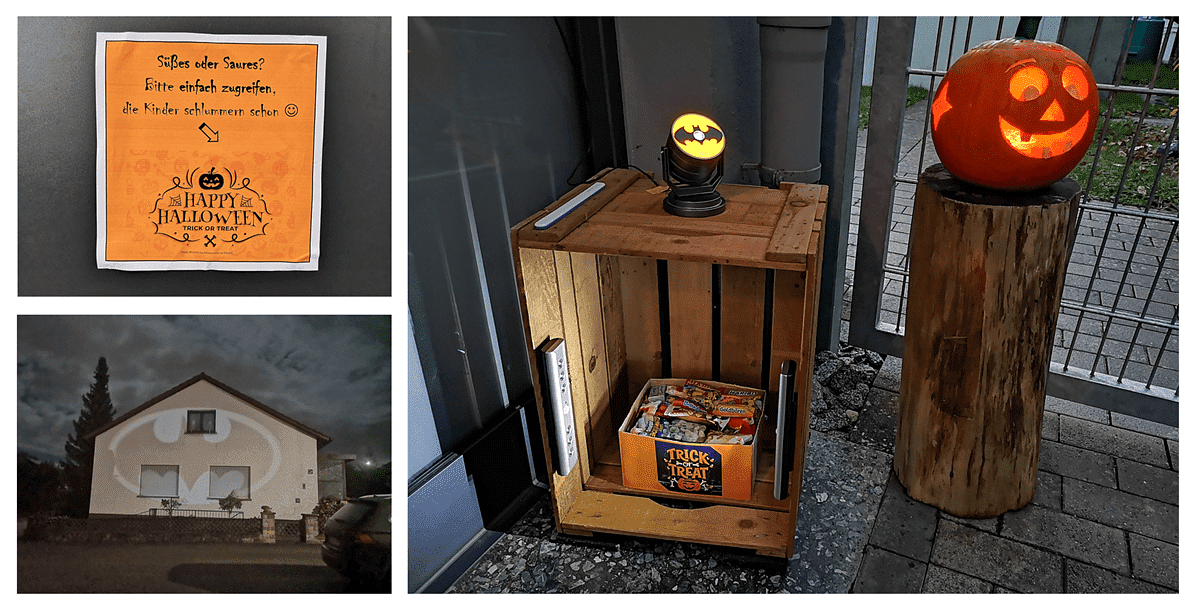
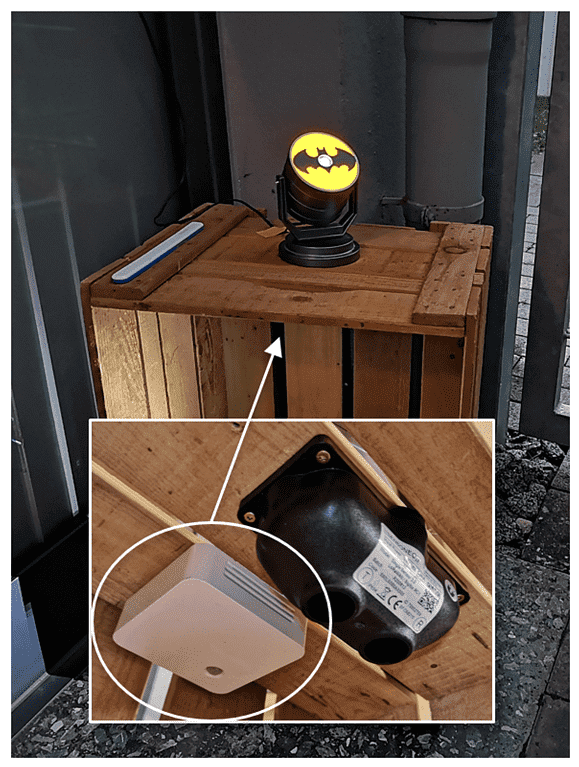
The base for my setup was an old apple crate, some of which we still had down in the basement. I was finally able to attach the sensors selected in the office to this so that the monitoring of the candy box worked as planned. The correct placement of the devices was determined, on the one hand, from the information in the respective manuals or assembly instructions and, on the other hand, from some test measurements in advance. The box itself was simply placed at the bottom of the upright box. I put our little Batsignal on the box, which was supposed to attract a little more attention by illuminating the neighboring house opposite. In the following, I will show you exactly which sensors were involved and where they were attached to the crate.
Here are photos of my final installation at the house entrance:
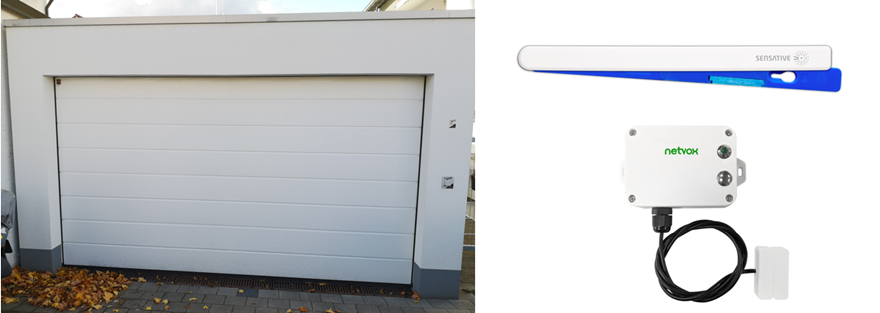
Light Sensor for Monitoring the House Entrance
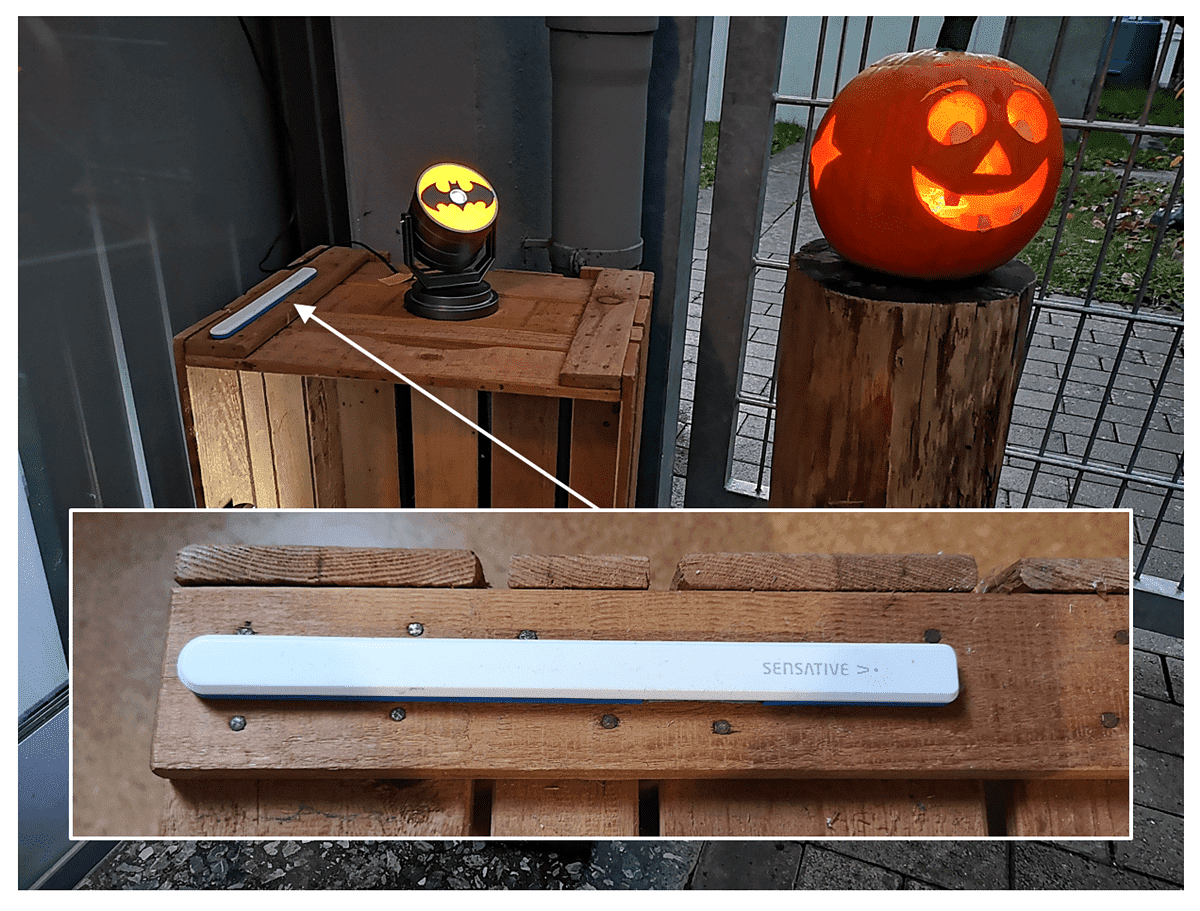
Since I had already used the ELSYS ERS Co2 available to me to detect motion on the candy box (more on this below), I decided to detect motion on the front door by the automatically switched on lighting. To do this I needed a device with a light sensor, in this case a Sensative Strips Multisensor +Drip. Positive side effect: Thanks to the leakage detection, I was also able to be notified if the box got too wet. After all, October 31st was very rainy this year, at least for us.
Placement on the Box
I simply attached the Strips +Drip to the top of the outside of the apple crate. I was able to simply attach the associated mounting plate with two screws and the sensor itself is then hung into the plate.
As it turned out later, I had overlooked a small aspect when placing the light sensor, but more on that later.
Measuring and Sending Behavior of the Light Sensor
I have configured the sensor so that it always sends as soon as the measured lux value is greater than 0 and when water is detected. I deactivated all other parameters that were not required. I kept the standard interval of 0.5 minutes as the measurement interval in order to detect a change as quickly as possible. I simply generated the payload required for this configuration using the Strips Configurator app and then sent it to the device as a downlink via the ZENNER Datahub.
Level and Motion Sensor to monitor the Candy Box
Now let’s get to the most important part, monitoring the candy box.
Level Measurement with Sensoneo Single v3.0
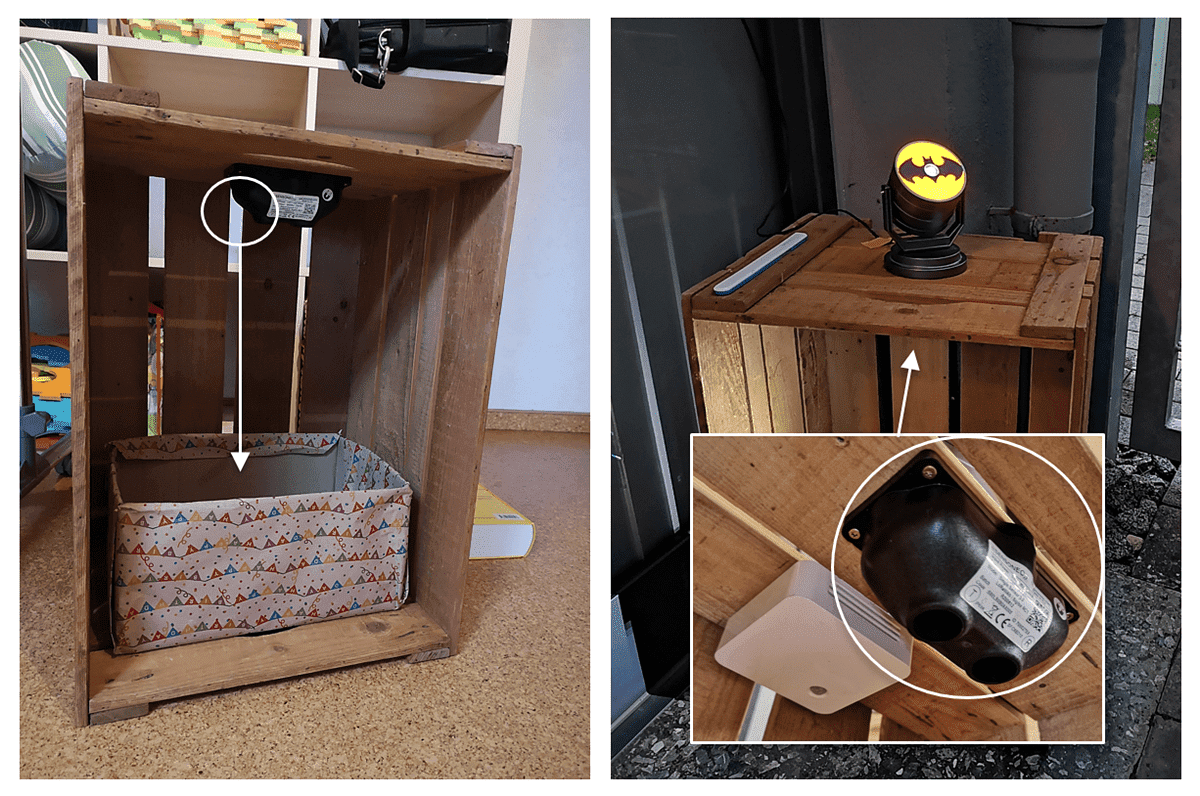
To record the fill level, I used the Sensoneo Single v3.0 ultrasonic sensor. This detects the current filling level based on the measured distance of the candy to the sensor.
Placement on the Box
The Sensoneo Single v3.0 was simply screwed to the top of the inside of the box so that the “tranceiver”, which sends out the ultrasound pulses for the measurement, is located in the middle above the candy box.
Measuring and Sending Behavior of the Level Sensor
In the standard factory configuration, the sensor only measures and transmits at certain times, usually at an interval of 2 hours. For this reason, I changed the measuring and sending interval to every 10 minutes using the Sensoneo Configurator Smartphone App. For some reason, however, this setting has since changed again, which is why I unfortunately ended up with fewer measurements than originally planned.
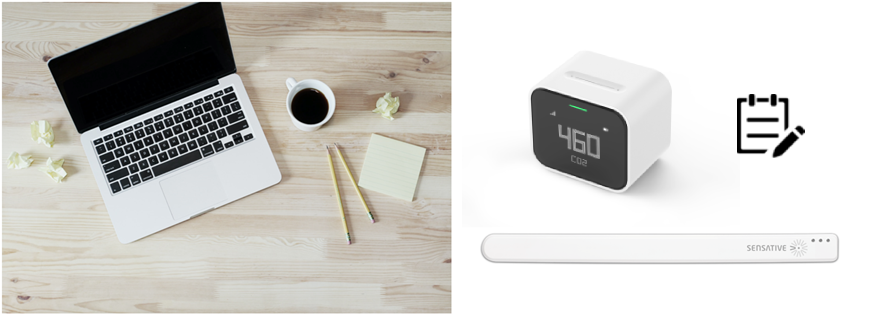
Motion detection with ELSYS ERS Co2
To detect motion on the candy box when reaching in, I used the ELSYS ERS Co2 sensor, which also has a motion sensor installed in addition to the Co2 sensor.
Placement on the Box
In order to find the right placement for the ELSYS ERS, I had to experiment a bit. For example, if the sensor was attached too far to the front of the box, simply walking past the box was recorded as a movement and not an actual reaching into the box. I finally had success with the installation behind the Sensoneo.
Dashboard for Data Visualization and Evaluation
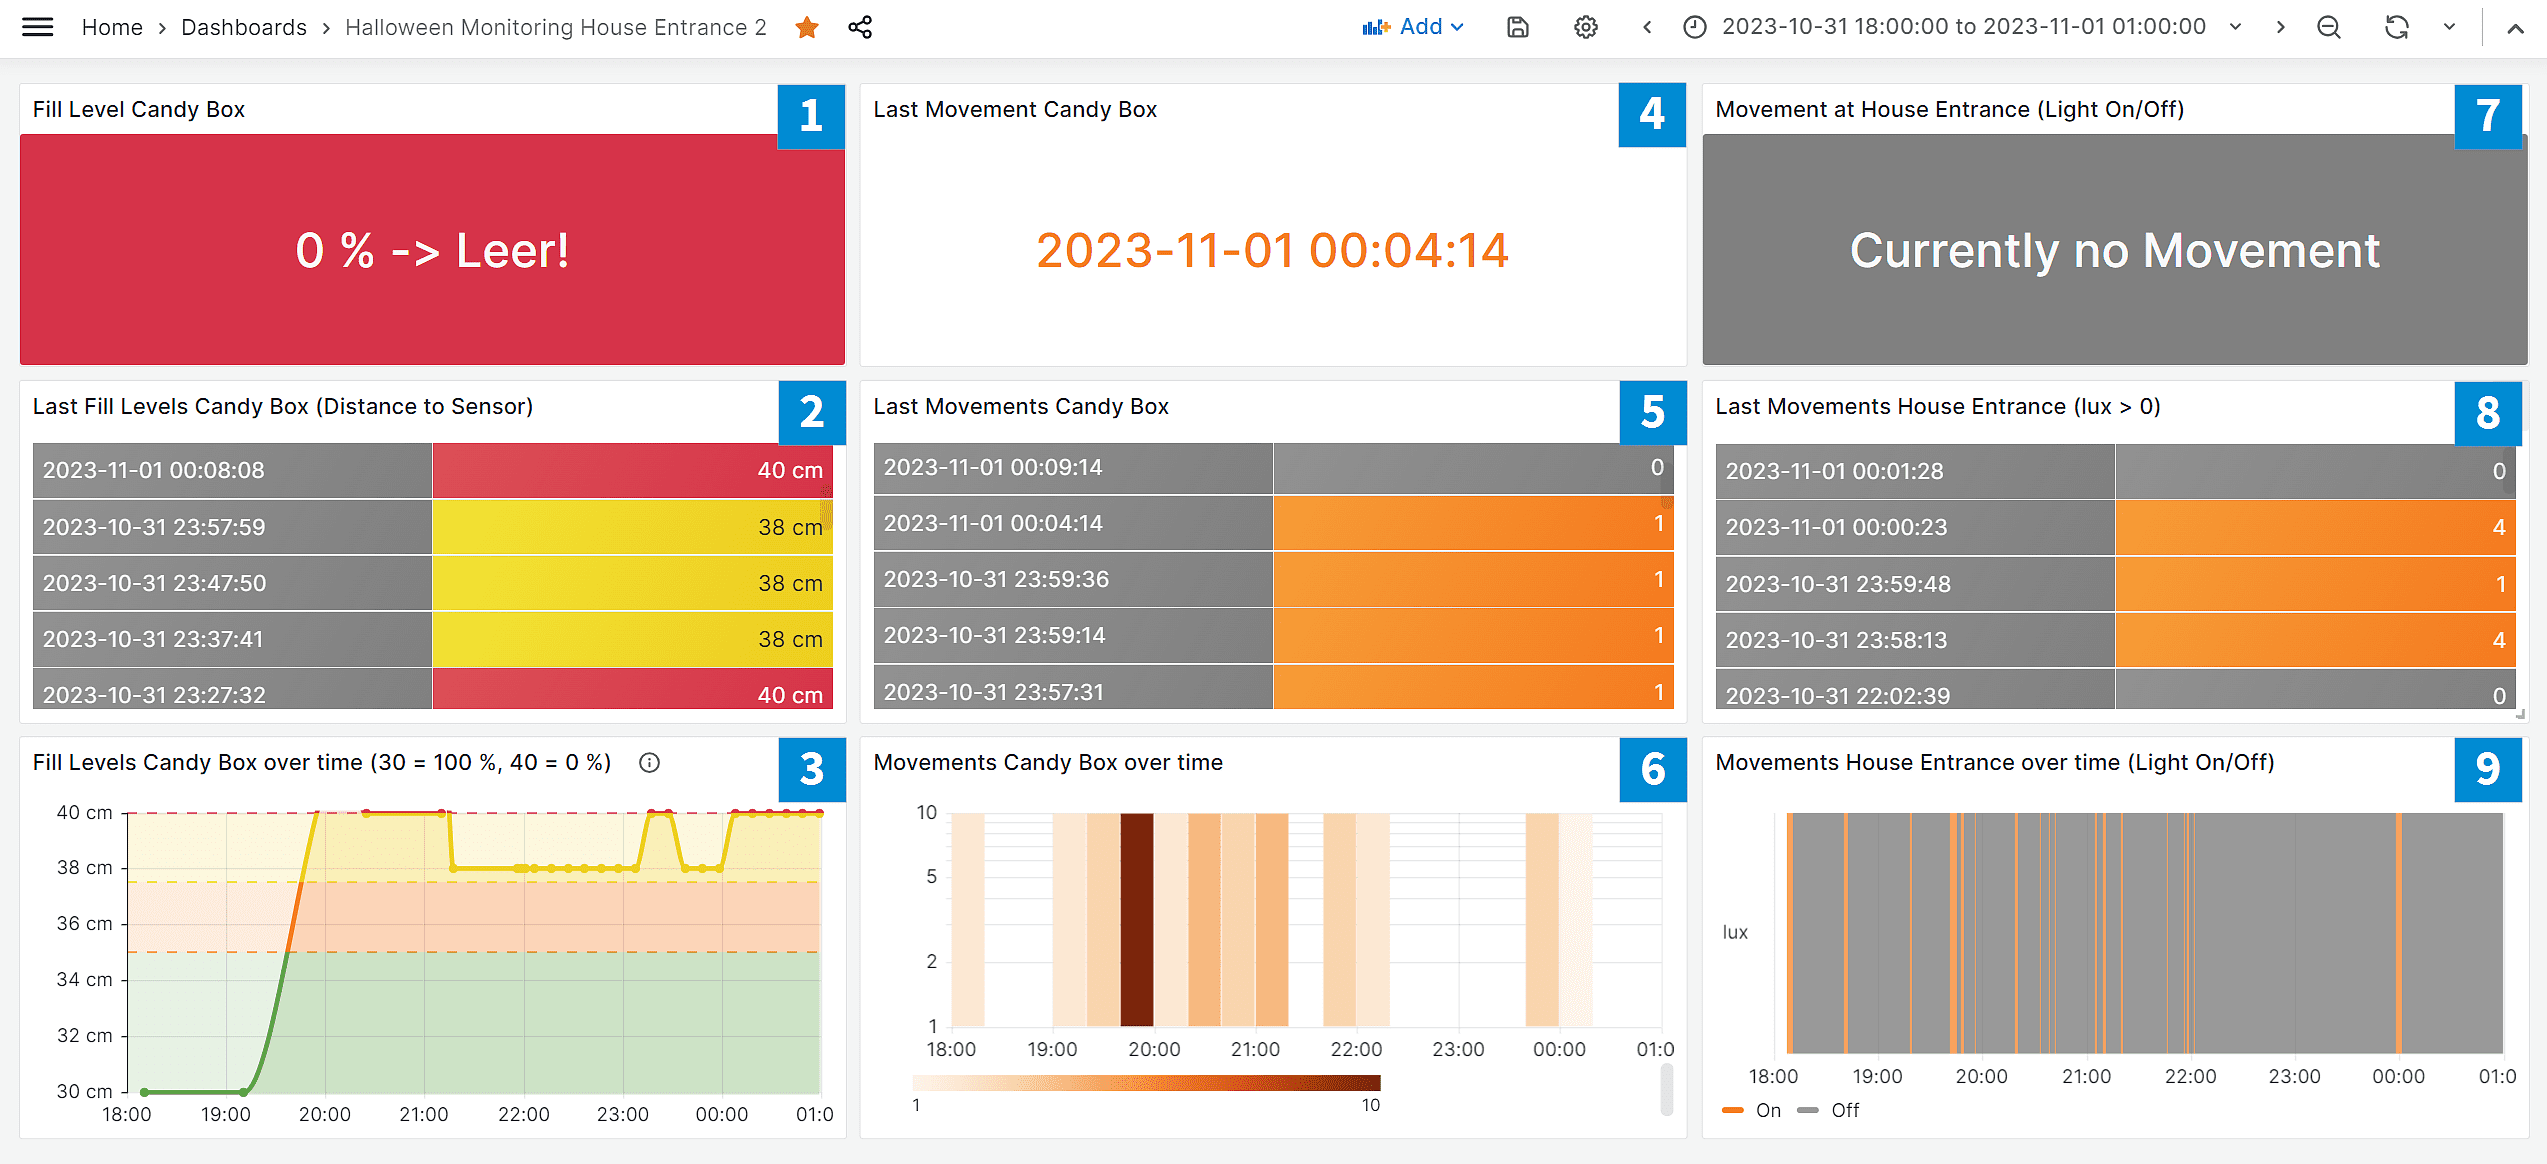
In order to visualize the data and be able to evaluate it better after Halloween, I created a Grafana dashboard, as I did with soil moisture monitoring in my garden. As you can see in the screenshot below, my dashboard consisted of the following 9 panels, with the most important ones for me being arranged at the top, especially for convenient display on the smartphone:
Email Notifications via B.One Gallery
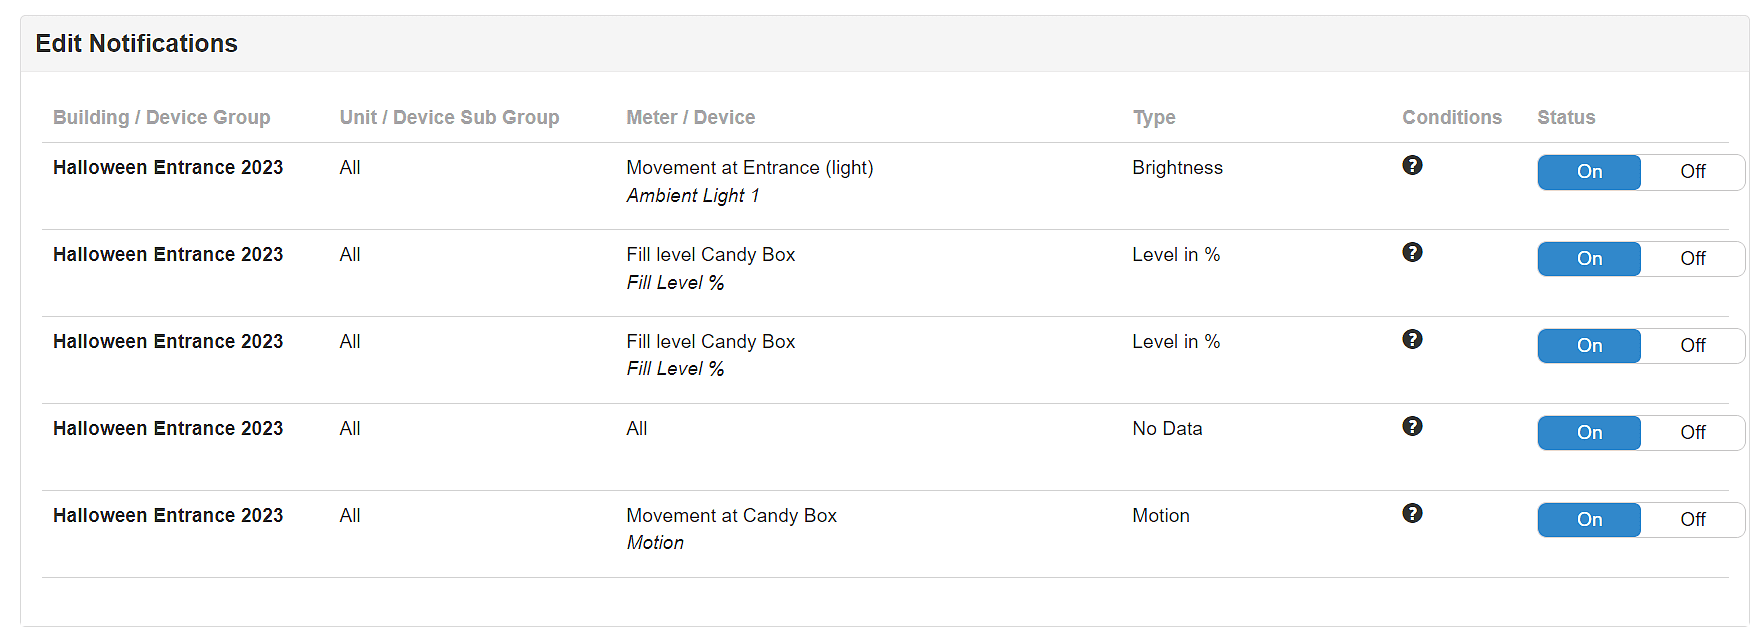
Finally, I set up the desired email notifications via B.One Gallery, which is much easier and faster than using Grafana and a Telegram bot, for example. I have created notifications for the following events:
- One of the sensors stopped sending data for more than 1 hour
- The lux value of the light sensor is> 0 = movement at the house entrance
- The motion sensor on the candy box triggers = movement on the box
- The fill level of the candy box is <= 50 %
- The fill level of the candy box is <= 25 %
Data Evaluation and Further Findings
Now that you have seen how I implemented my LoRaWAN Halloween house entrance monitoring, I would like to share the results of the data evaluation as well as further findings or learnings with you.
Data Evaluation
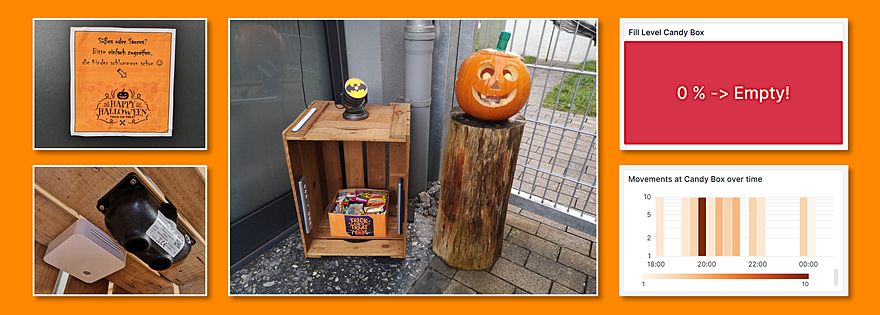
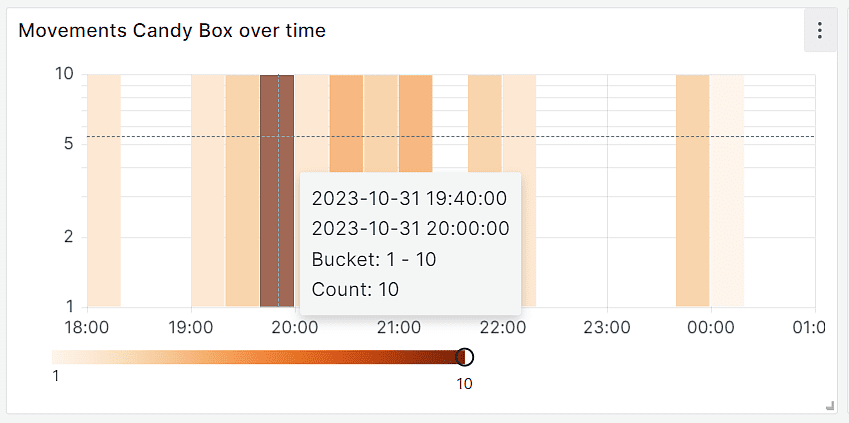
Peak Hours at Candy Box
As can be seen, the movements at the candy box were mainly recorded between 7:00 p.m. and 9:30 p.m. Most of these took place between 7:40 p.m. and 8:00 p.m.. Only two movements were recorded before 7 p.m. This can probably be explained by the fact that going around the houses and collecting trick or treat is more for the “smaller” children, who then have to go to bed. The last three non-self-triggered movements at the box occurred between 11:40 p.m. and 12:00 p.m.
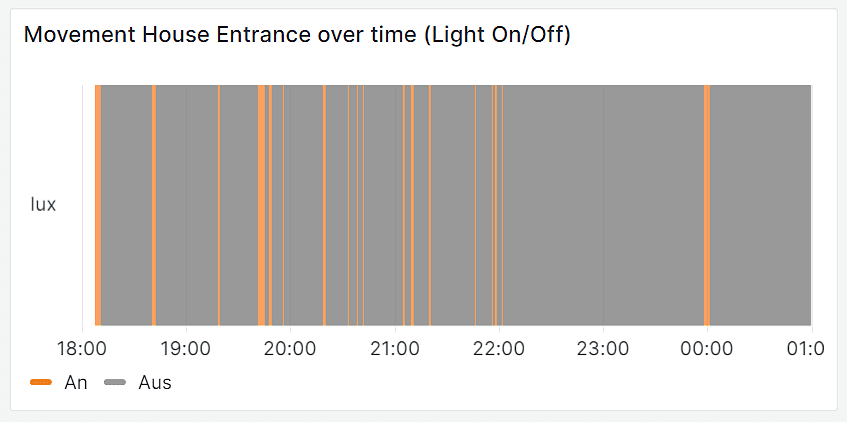
Peak Times at the Entrance
As far as the peak times at the house entrance itself are concerned, i.e. the times at which the automatic light was switched on, these logically also correlate with those at the candy box. However, it can also be seen here that there was movement at the entrance to the house without there being any movement at the box. This showed me that I had overlooked a possible light source, namely the automatic light when there was movement in our stairwell, which was also detected by the sensor through the glass pane at the entrance.
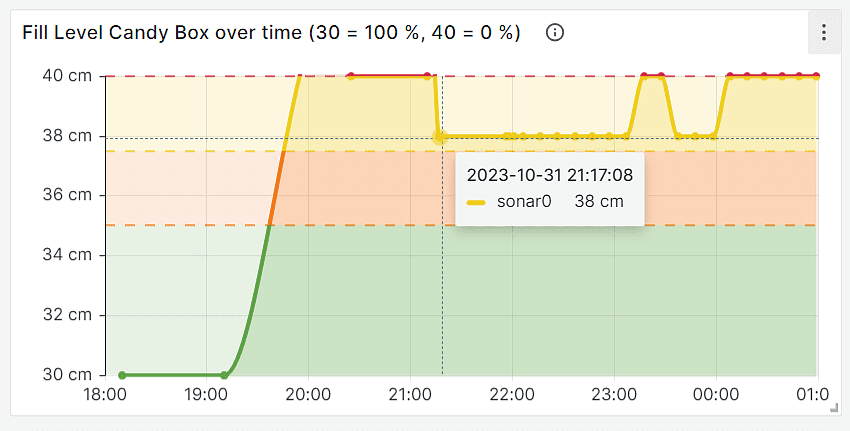
Fill Level Development in the Candy Box
As already mentioned above, unfortunately I had fewer measuring points for the fill level than planned. Nevertheless, the process was understandable and I was also informed if there was little or nothing left in the box. Due to the initially hourly measuring and sending interval, it first looked as if the fill level would not change at all, until it suddenly reached 0 % at 8:24 p.m. After we were back home with our own children, I filled the box back up to almost 25 %, which corresponded to a measured distance to the sensor of 38 cm. After the last movements between 11:40 p.m. and 12:00 p.m. the box was empty again. What was also noticeable when measuring the fill level was that after 11 p.m. the level initially fell back to 0 % and then rose again to just under 25 %, even though the box was neither empty nor refilled again. This showed that the measurement was also heavily influenced by how accurately the candy actually lay in the box and whether or not there were gaps to the floor.
Further Insights and Learnings
In addition to the evaluated data, I was able to draw further insights and learnings from the use case, which I will briefly summarize here:
- The Batsignal generated more attention than last year, when there was only a simple box
- When placing the light sensor, no light sources should be forgotten, especially if the sensor is only supposed to react to a specific light source, as in this case
- All three of the sensors used could or can be reconfigured quickly and easily, some via app + NFC and some via app + Bluetooth. Only for the Sensoneo Configurator App you first need access data from the manufacturer/provider and here it was also important to keep your smartphone as close to the device as possible so that the Bluetooth connection does not break down in the meantime
- All three of the sensors used measured and transmitted reliably, with the following two small exceptions:
- As already described, the Sensoneo had automatically reset itself to an hourly transmission interval. Unfortunately I couldn’t figure out exactly why, but I was able to quickly correct it
- The Sensoneo had a little difficulty here and there with the correct measurement when the candy density was no longer that high and the emitted ultrasound beams could reach the bottom of the box through small gaps. A small follow-up test showed that e.g. the Pepperl+Fuchs WILSEN would be a good alternative for next year as he was able to cope better with it
- Email notifications via B.One Gallery worked reliably and were much easier to set up than, for example. via Grafana
Expansion and Customization Ideas for 2024
Last but not least, three expansion/adaptation ideas for 2024 :
- Triggering an action when movement is detected, possibly by integrating IFTTT and using the ZENNER Datahub RuleEngine. For example:
- Playing spooky Halloween sounds via my Alexa, e.g. screams when reaching into the candy box or when walking to the front door
- Turning on a radio-controlled socket that has a spooky or funny Halloween gadget connected to it
- Recording satisfaction with candy selection via a sensor such as the Skiply Smilio Action Multiservices Button
- As mentioned above, possibly using the Pepperl+Fuchs WILSEN as an alternative level sensor
Do you have any other ideas for Halloween house entrance monitoring, have you ever implemented a similar use case yourself or have experience with processing LoRaWAN® packets via IFTTT? Then I look forward to your comments and a mutual exchange! 🙂


Responses