ZENNER Datahub Howto: Connection to the IoT platform Kaa
Last modified on 10th April, 2024
In my last article I already showed you how you can connect the ZENNER Datahub to the IoT platform TagoIO. Today we come to the next platform in my little series of posts. This is Kaa.
Like the first platforms in this series, Kaa also offers us the opportunity to collect data, process it and visualize it on dashboards using so-called widgets. Kaa also has a free version. However, this limits us to a maximum of five devices that we can configure on the platform. In this article I will explain how to create a sensor on the platform, how to connect the data hub to the platform (http) and last but not least, how to visualize the data on so-called dashboards.
Step 1: Create a Device
When we create devices in Kaa, they are classified according to applications. An application can have several versions (application version). The versions are practically different configurations of the application. In the respective applications/application versions, it is possible, for example, to configure how incoming data is to be handled. In these instructions we only use one version per application and only assign one device to it (several are possible).
To create our first application, we navigate to DeviceManagement/Applications in the main menu. There we can then name and create our first application via “Add application”.

Now a version has to be added to the application. Simply click on the + icon and name the version.

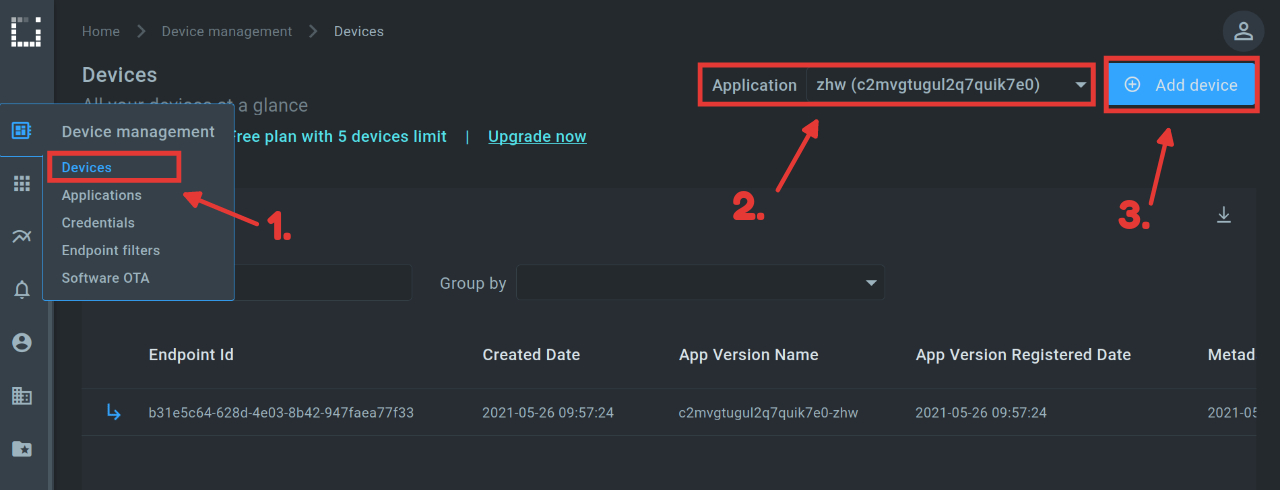
We then navigate to DeviceManagement/Devices. Before we click on “Add Device” there to create our first device, we select the application we have just created on the left.
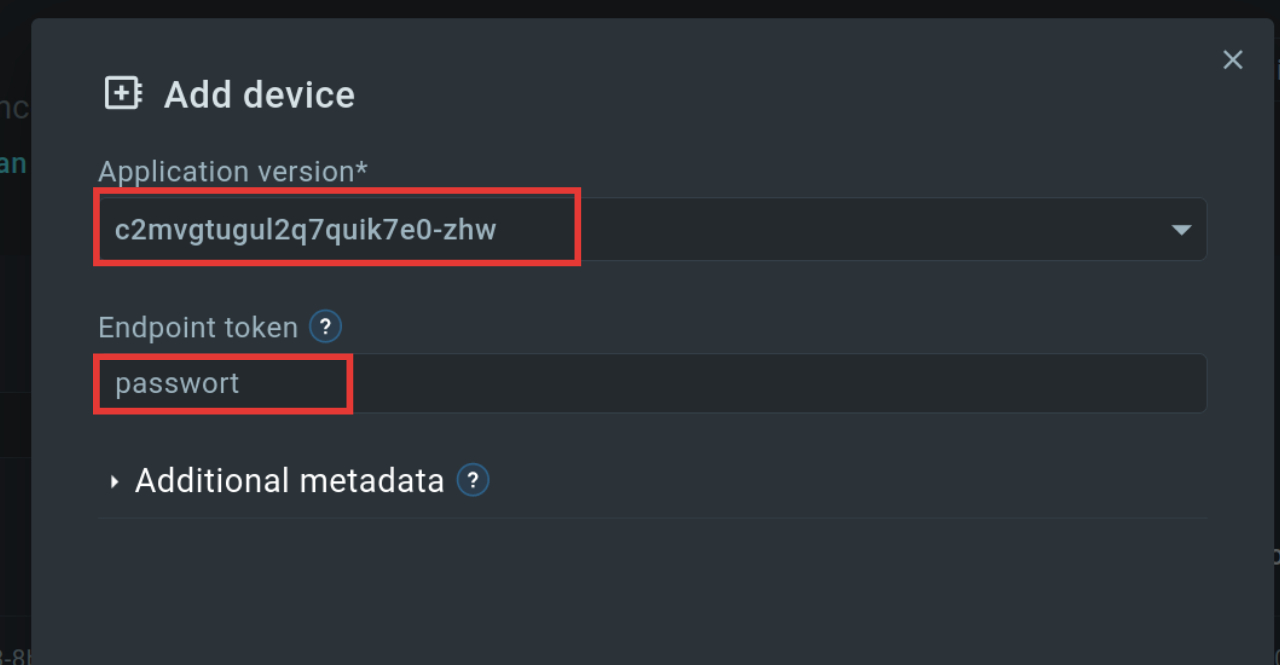
When configuring the device, we can specify an application version and an “endpoint token”. For the version we choose the version we just created and for the token any character string. The token is later used to authenticate the device.
Step 2: Connecting the ZENNER Datahub
Step 2.1: Set up Forwarding
After we have created the device on the platform, the next step is to connect it to the ZENNER Datahub. In this post, we use HTTP as the transmission standard. You can read how to set up such a forwarding in the blog post “ZENNER Datahub Howto: Setting up forwardings”. The redirect URL must conform to the following format:
HTTPS//connect.cloud.kaaiot.com:443/kp1/APP-VERSION-NAME/dcx/ENDPOINT-TOKEN/json
We replace the values APP-VERSION-NAME and ENDPOINT-TOKEN with our application version and the token of our device.
Step 2.2: Processing the incoming Data
So that a widget can later access the incoming data, it must be stored in the so-called “Time series data”. If we send JSON data to the platform and the keys in it each have only one associated value (no further nesting/map), each key/value pair is automatically stored in the “Time series data”. Since this is not the case for us, we have to make an adjustment.
Example nested data:
{
“data”: {
“unmapped”: {
“temperature” : 12,
“gps_quality” : 8798,
“latitude” : 1,
“longitude” : 1,
…
}
}
}
For customization, we navigate to DeviceManagement/Applications. There we open our application and then the epts (endpoint timeseries service) Field. When the epts window is open, we can use the “Add endpoint timeseries” button to define which data should be saved.
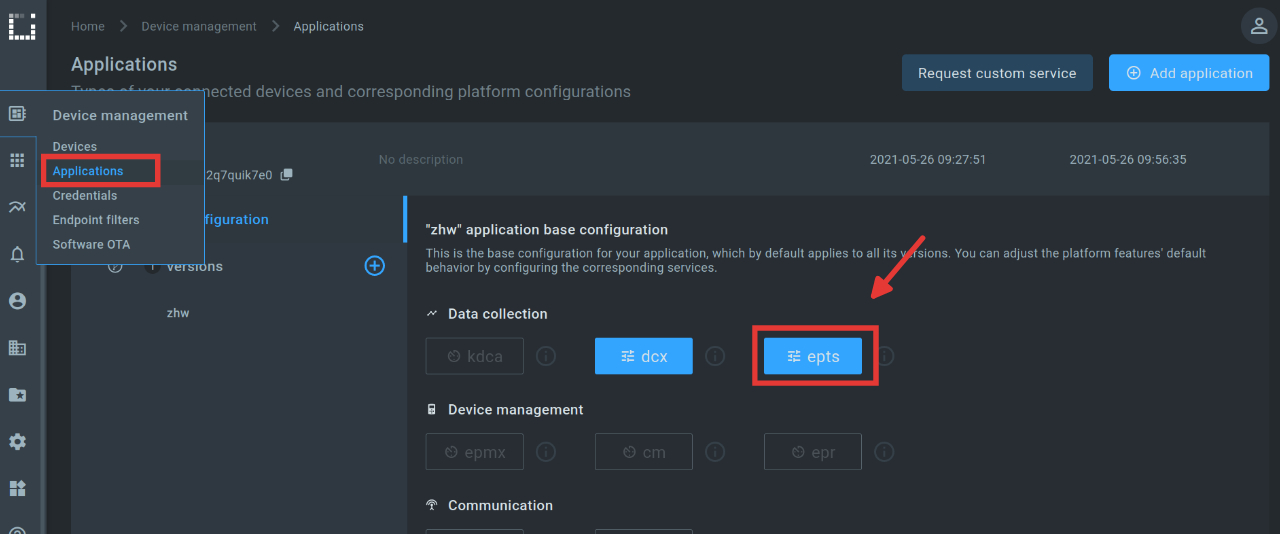
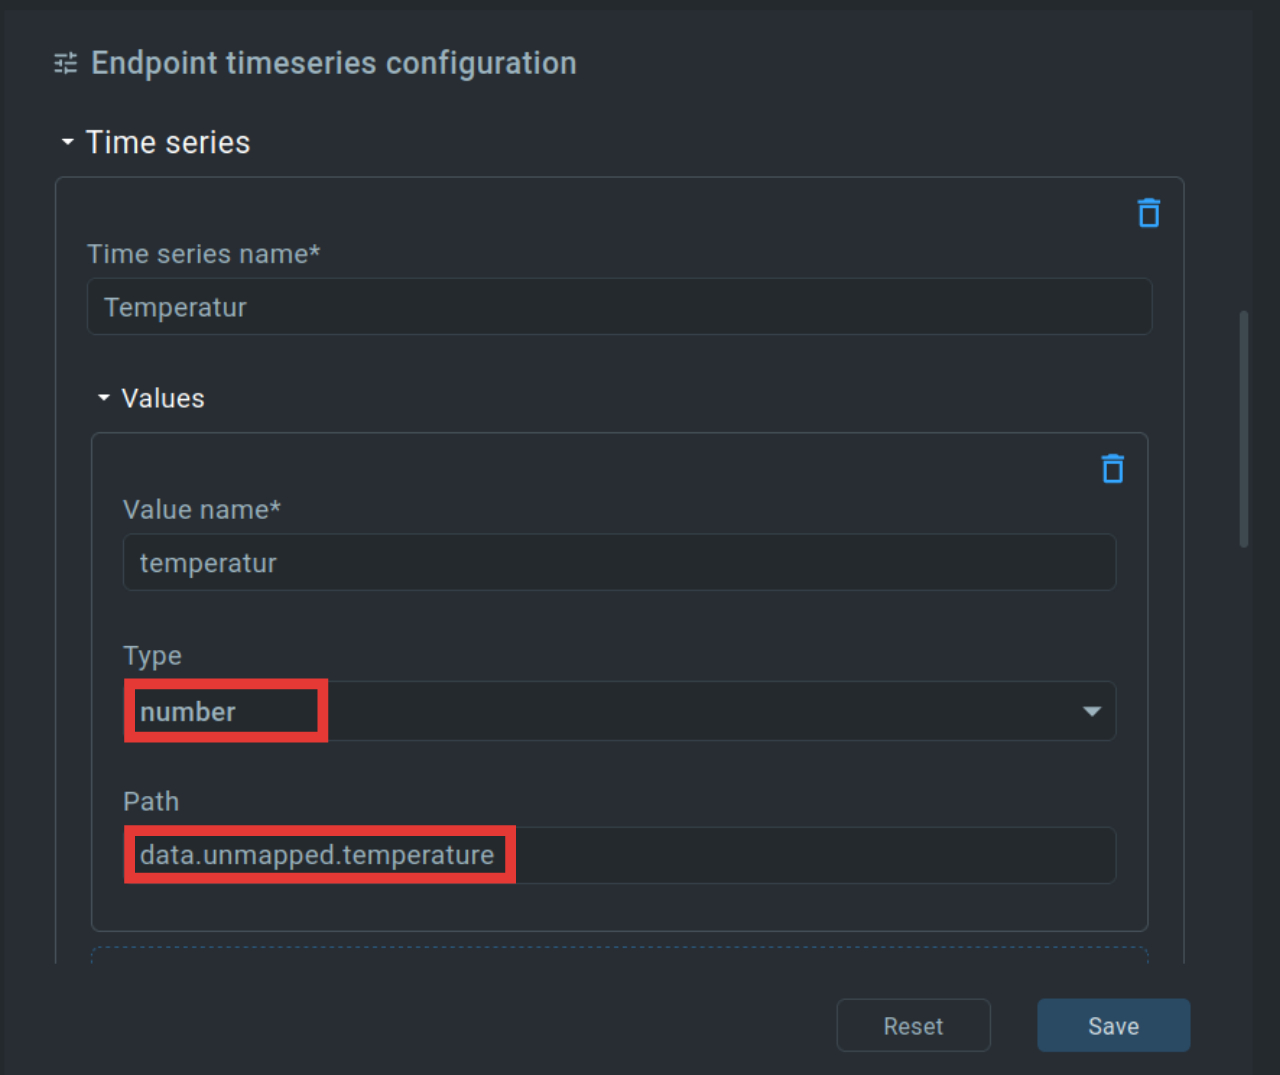
We find most of the relevant values in the telegrams sent by the Datahub under data/unmapped. To read the temperature of a sensor, for example, the following configuration must be made:
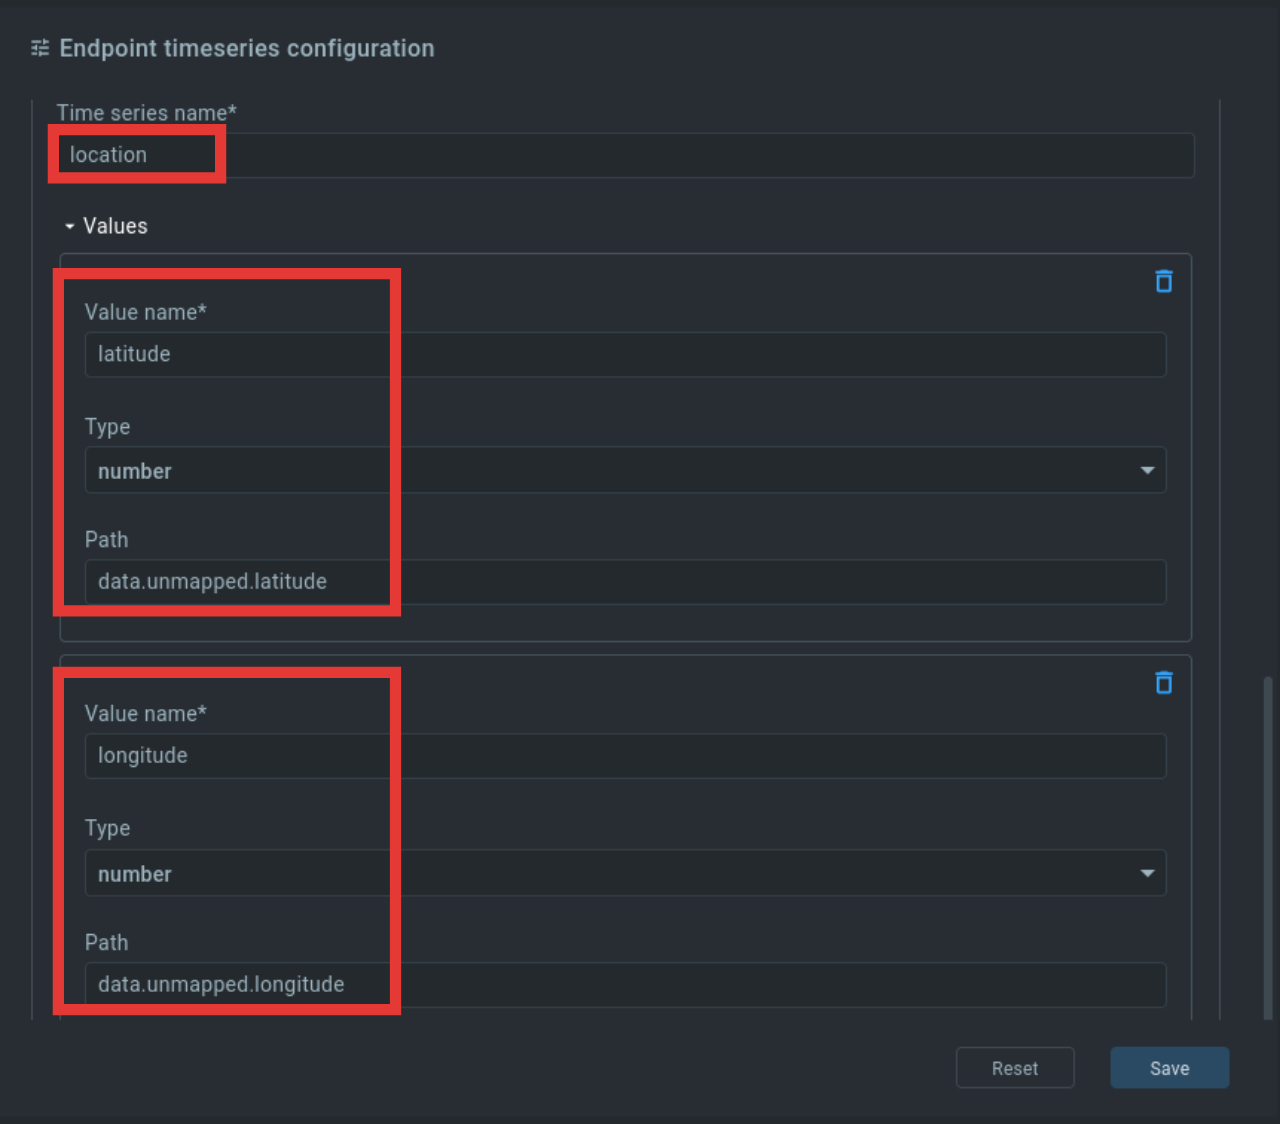
To be able to show us the location of a device later, we combine the values for longitude (longitude) and latitude (latitude) into one value location.
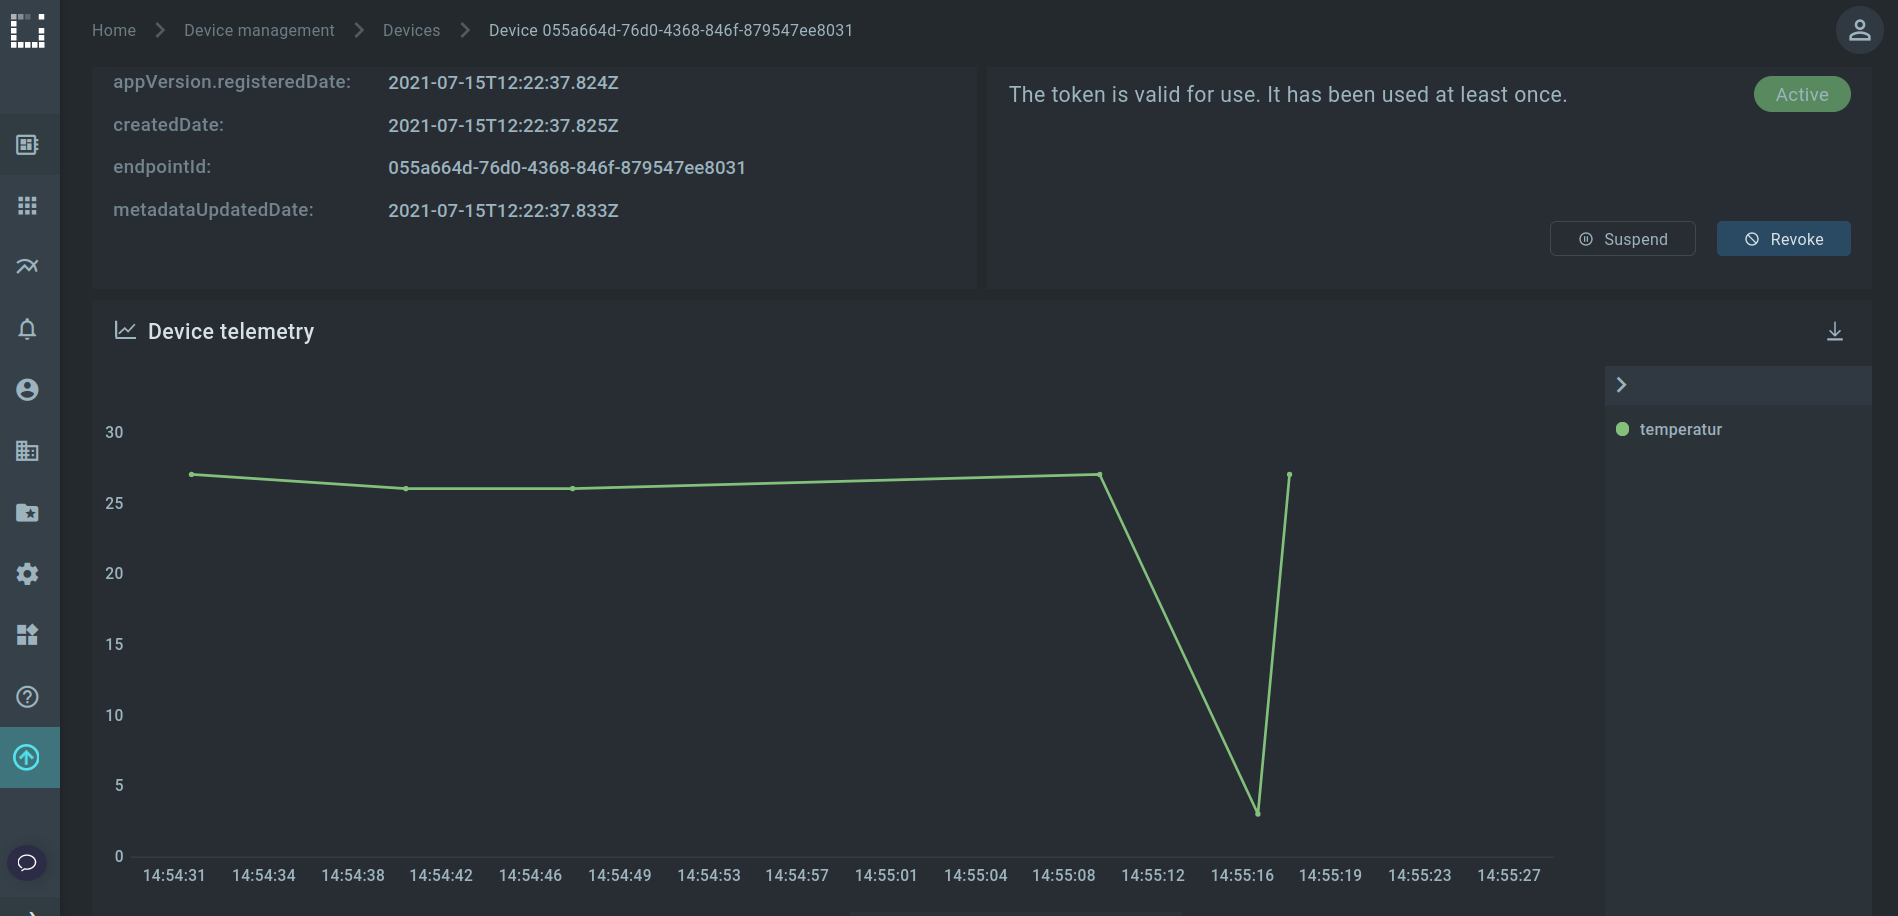
If we navigate to DeviceManagement/Devices and open our device, we can now trace the history of the incoming data, provided we have done the previous configuration.
Step 3: Visualization of the Sensor
Step 3.1: Create Dashboard
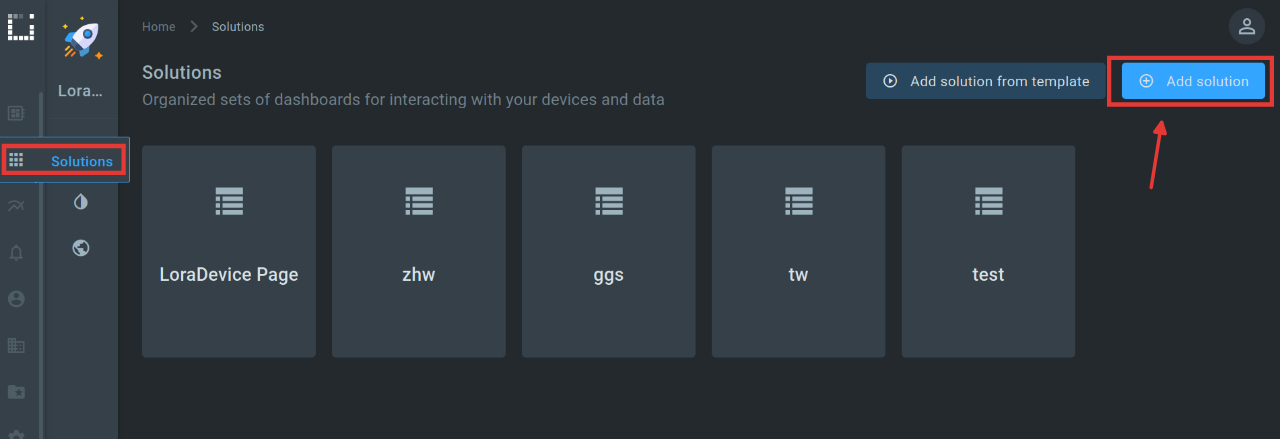
We can display our data in Kaa on dashboards. A dashboard can contain multiple widgets. Widgets can be simple maps where we can display individual values, but also more complex things like maps to show location or graphs to visualize data over time. For an overview, the dashboards in Kaa are arranged according to solutions. A solution can therefore contain several dashboards. To create our first solution, we navigate to Solutions and click on “Add solution”.
When we create a new solution, there is already a dashboard in it. To create more dashboards, we can click on “Add dashboard” on the top right. We now open the existing dashboard and switch to “Edit mode”. In this we can edit the dashboard.

Step 3.2: Create Map Widget
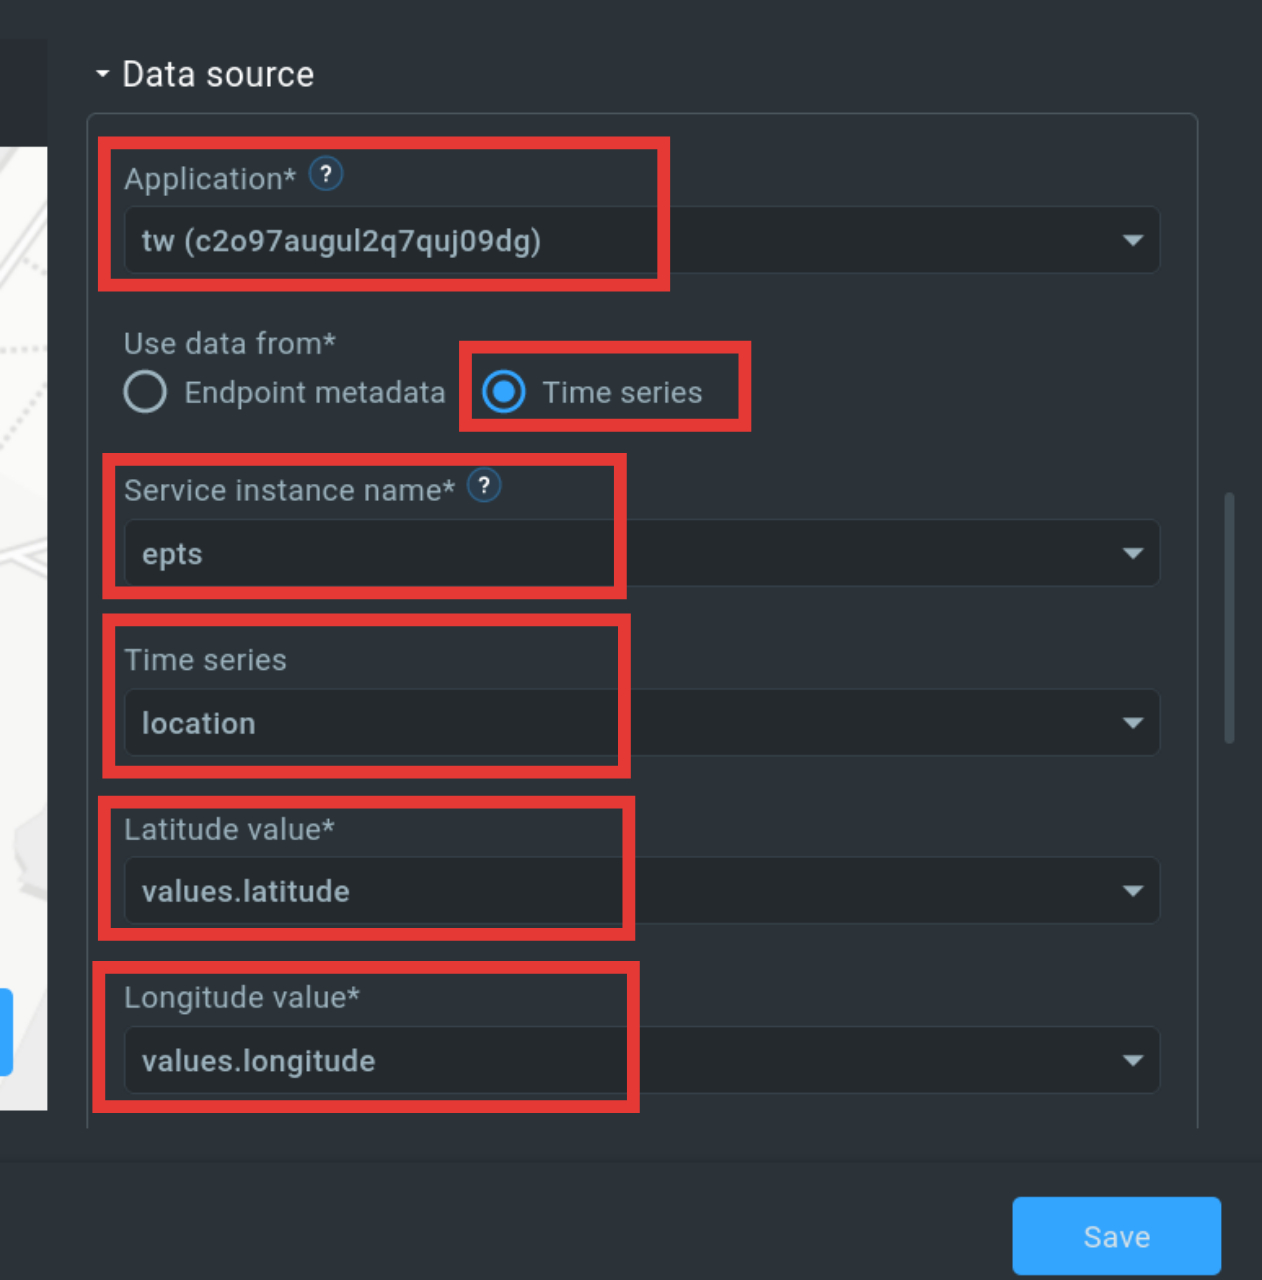
Map widgets are maps that we can use to show the location of devices. To create a map widget, we click on “Add widget” in the top bar and select the geopositioning widget there. The widget then needs to be edited. To do this, click on the pen icon above the widget and open the editing window. For now it’s enough for us if we only adjust the “data source”. We choose our application and the rest of the relevant parameters. Our first widget is ready.

Step 3.3: Create Time Series Widget
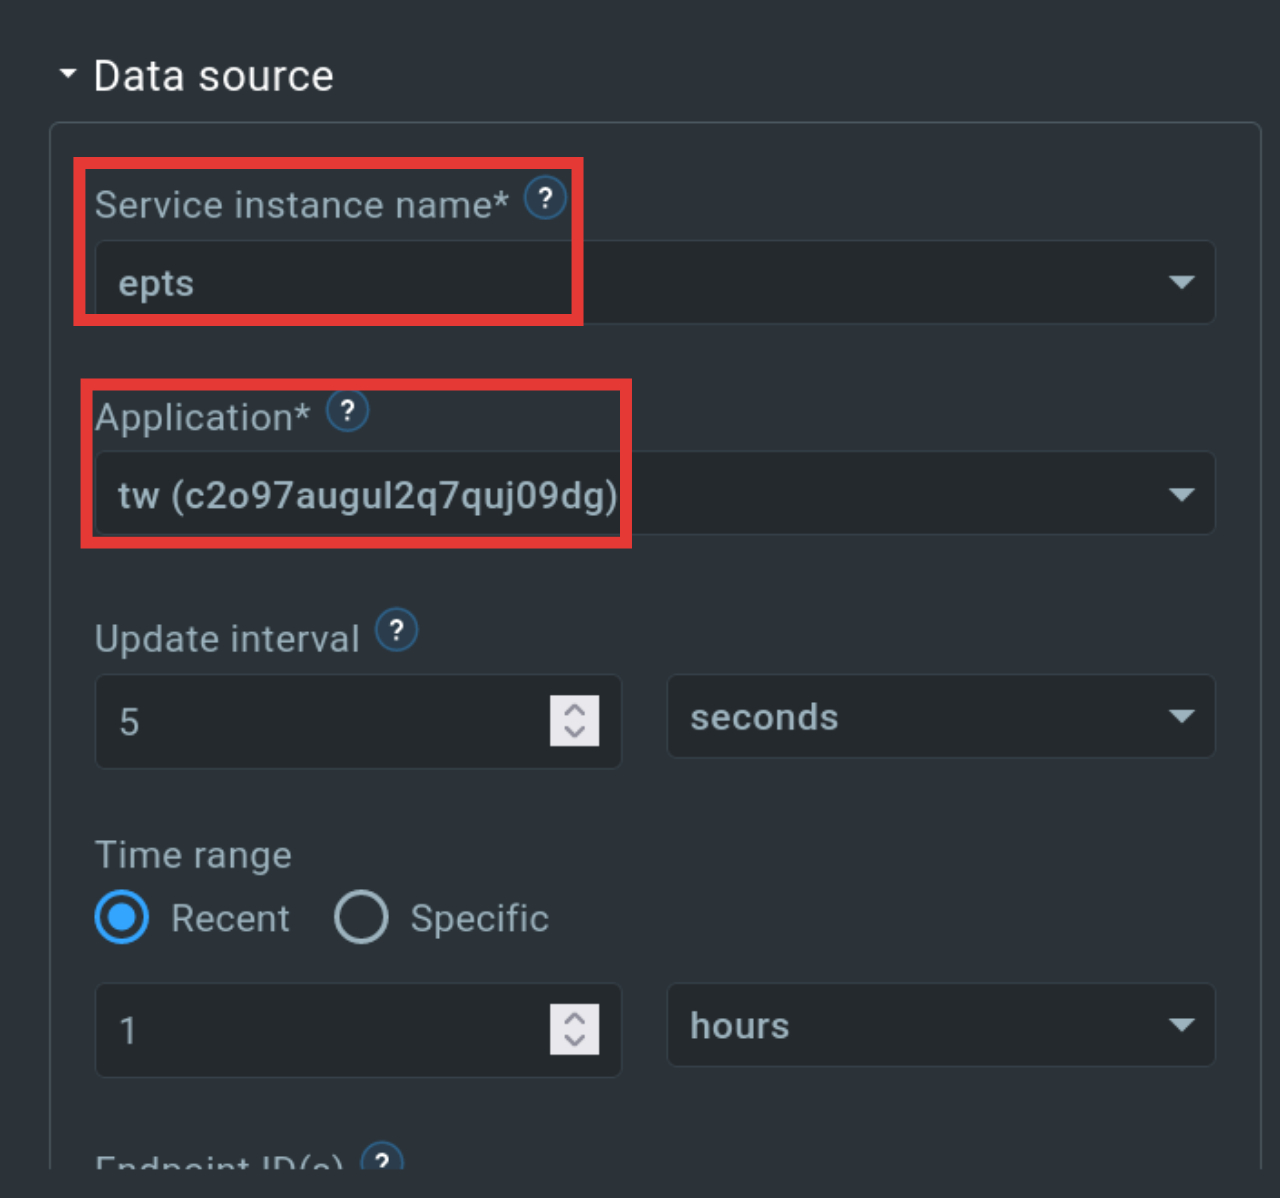
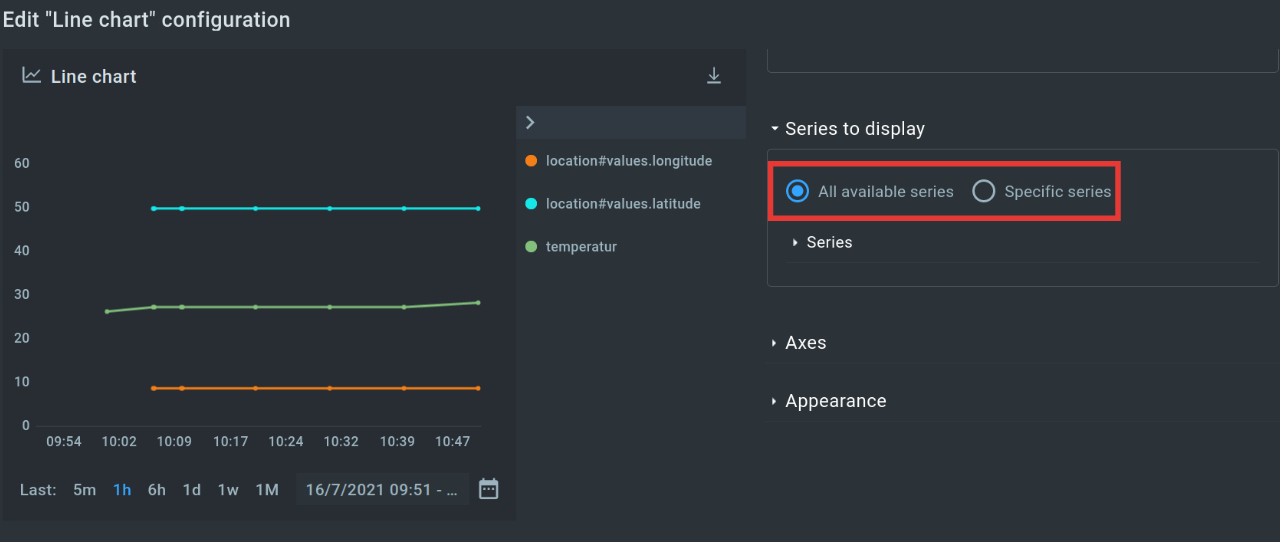
Now let’s create a time series widget. To do this, we click on the Time series Widget and select the “Multi-series line chart”. Then we switch back to the editing mode of the widget and adjust the “data source”. In addition, you can choose whether we want to display all (numerical) values of the application or only certain ones.
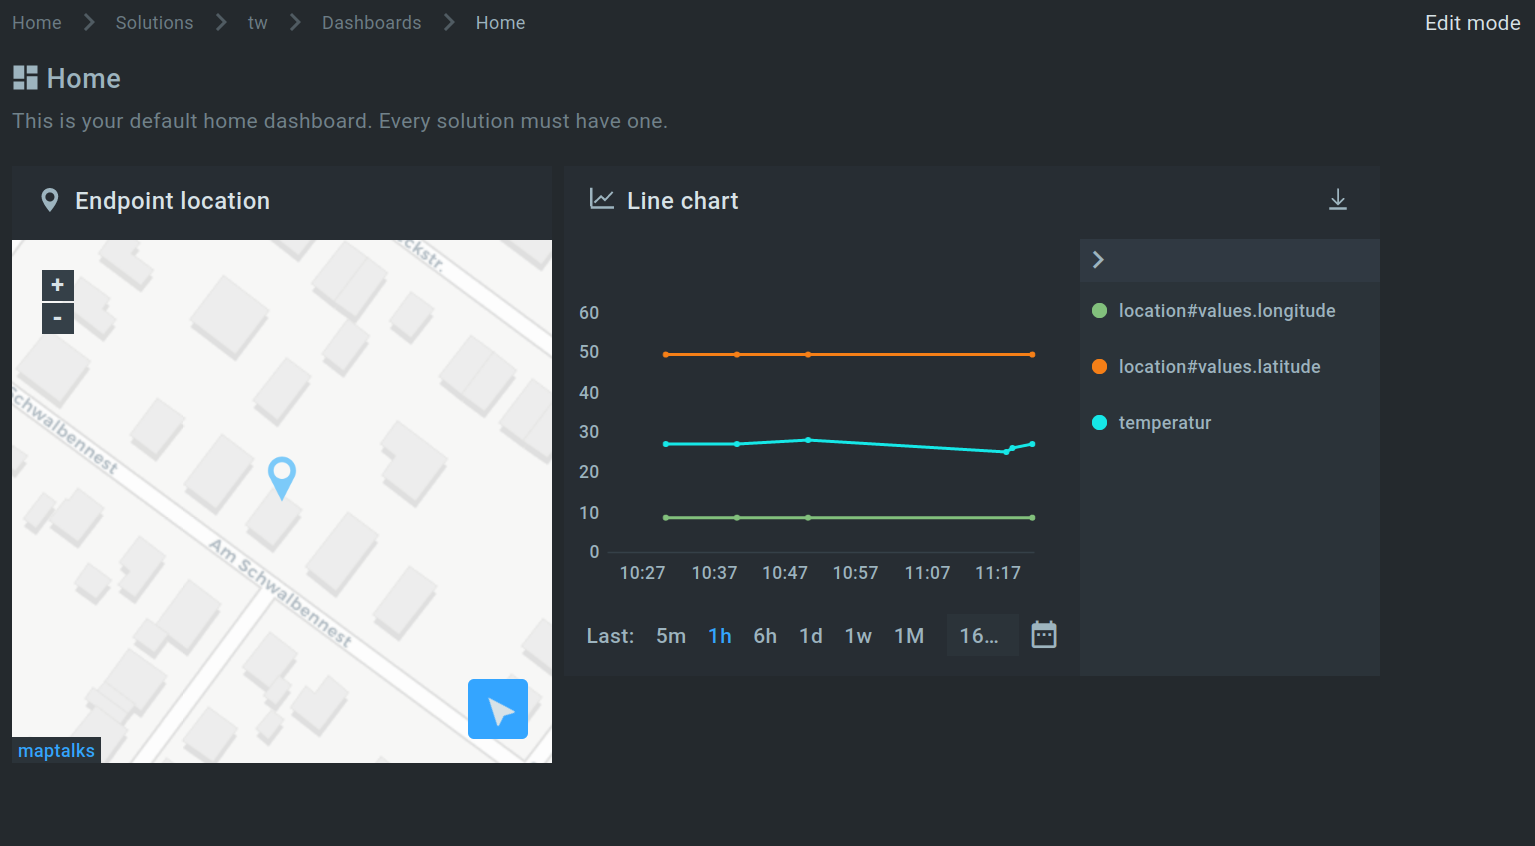
If you have set all the appropriate parameters, you will now see both widgets.
You now know how to connect the ZENNER Datahub to the Kaa platform and how to visualize your data on dashboards. In the next article I will show you this using the Thingsboard platform. Until then, have fun trying it out again!


Responses