IoT and Me 2021 – insight into my project – heat protection in summer
Last modified on 03rd May, 2024
Hello everyone and welcome to my blog post.
For all those who don’t know me yet and haven’t read the blog article “IoT and Me” competitors introduce themselves and their use case: my name is Cedric-Quirin Schneider, I’m 18 years old and come from the beautiful Erzgebirge region. I’ve been an apprentice at Minol for 2 years now and I am learning the profession of an office management clerk.
As part of the “Iot and Me” project, we, the trainees and students of the Minol-Zenner Group, are allowed to develop IoT solutions or ideas for the company’s own sensors. We received the following LoRaWAN® devices:
- ZENNER IoT GatewayPLUS Smart
- Sensative Strips Multi-Sensor+Drip
- Sensative Strips Presence
- Tabs Object Locator
We also received the associated visualization tools, such as the B.One Gallery and ZENNER Datahub as well as Grafana.
Explanation of the project
My project is a heat protection in summer. Nowadays it is not uncommon for the temperature to exceed 30 degrees in summer. Imagine leaving the cool apartment in the morning. After a long and hard day at work you come home exhausted and enter the apartment. From the moment the apartment door opens, you are faced with such an extreme wall of heat that you feel like you are in a sauna. Every citizen knows this problem.
The idea behind my project is that I send messages to the cell phones of the affected adults based on certain lux and temperature values, so that, for example, every adult on the go who has electrically adjustable blinds also knows when the best time is to shut them down. If it isbe forgotten and there are still children or elderly people at home, an alarm lamp powered by Philips Hue goes on.
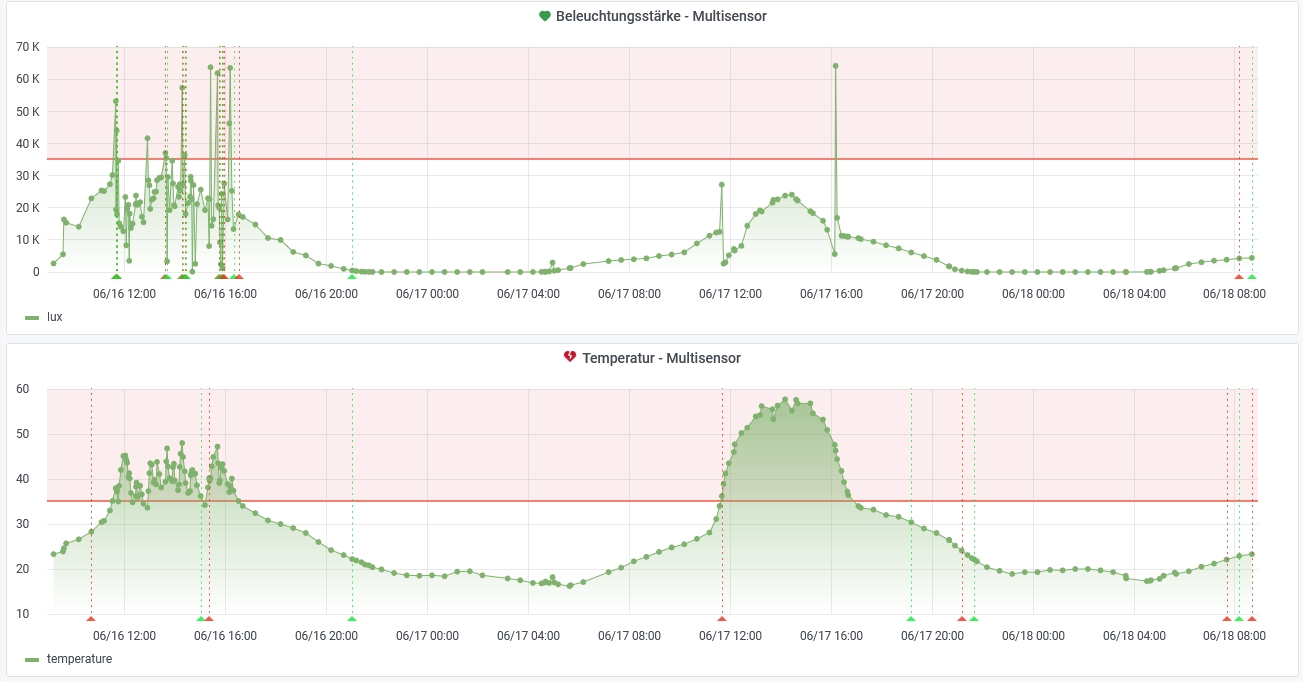
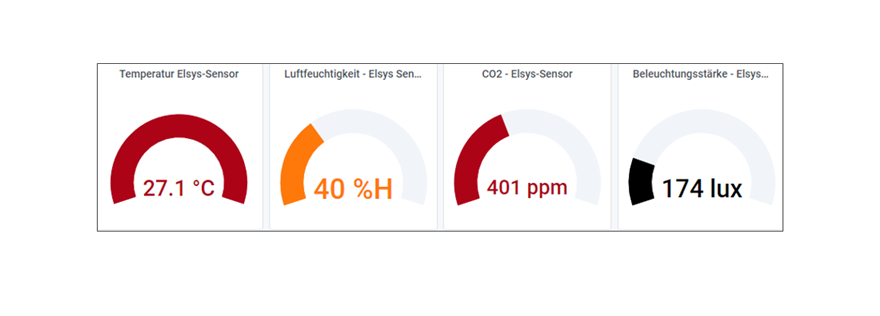
In the image below you can see the graph history of the last two days. My visualization tool for all recorded values is called Grafana. There you can see that I have set a limit of 35 degrees for the temperature graph, for example. At 35 I get a message on my cell phone and the Philips Hue lamp turns on.
Implementation and sensors used
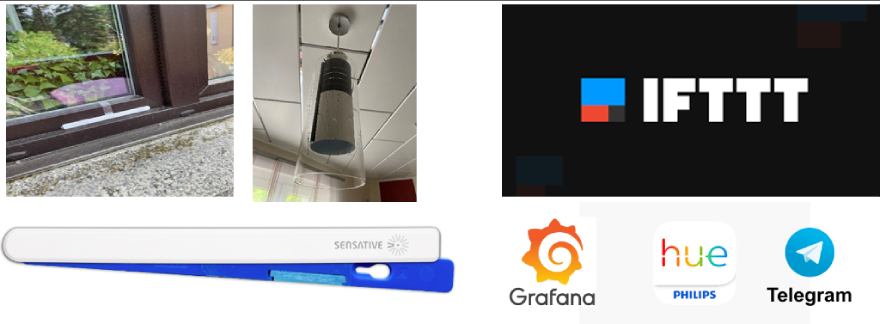
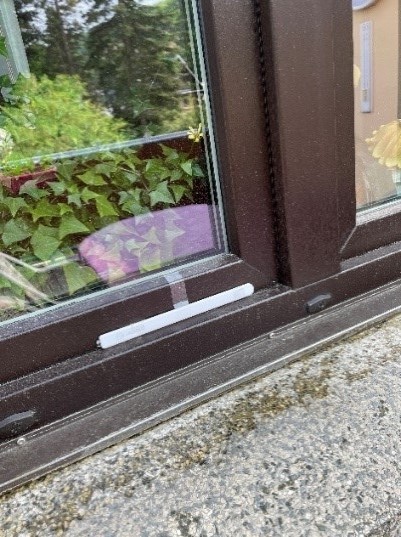
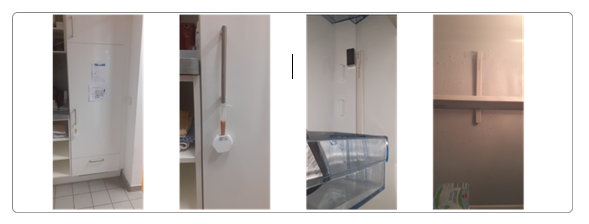
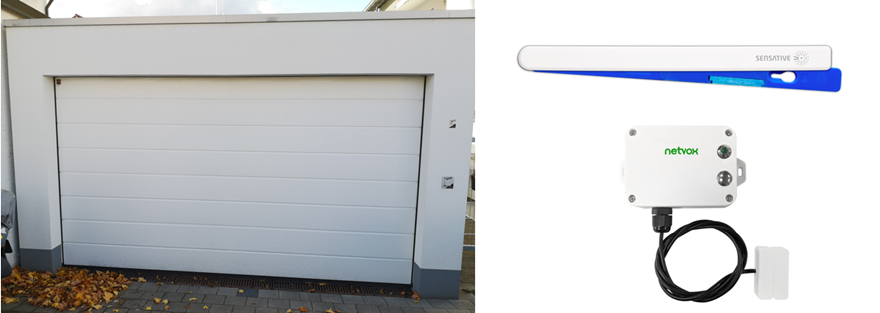
I use the Sensitive Strips Multi-Sensor+Drip to record the values. I attached this to the south side of my family home. With this I used the functions for measuring the temperature and the illuminance.
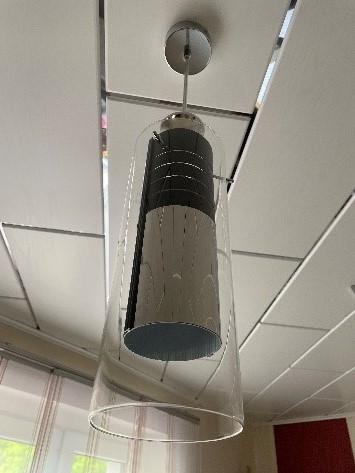
I installed the lamp with Philips Hue in the dining room because it is most noticeable there.
Difficulties and challenges
The biggest challenge was connecting Philips Hue to Telegram. Telegram is a chat program like Whatsapp. The lamp should be connected to Telegram. But to make this possible, I had to use an interface called “IFTTT”. IFTTT is a program that can be used to connect systems to one another. At first glance, I find the program quite complicated, which is why I had to fiddle with it first. After several initial difficulties, I realized that you first have to use a channel on Telegram. After I stored the channel and all previous settings, it worked. The channel is needed to transmit the command to be executed by an application (Philips Hue).
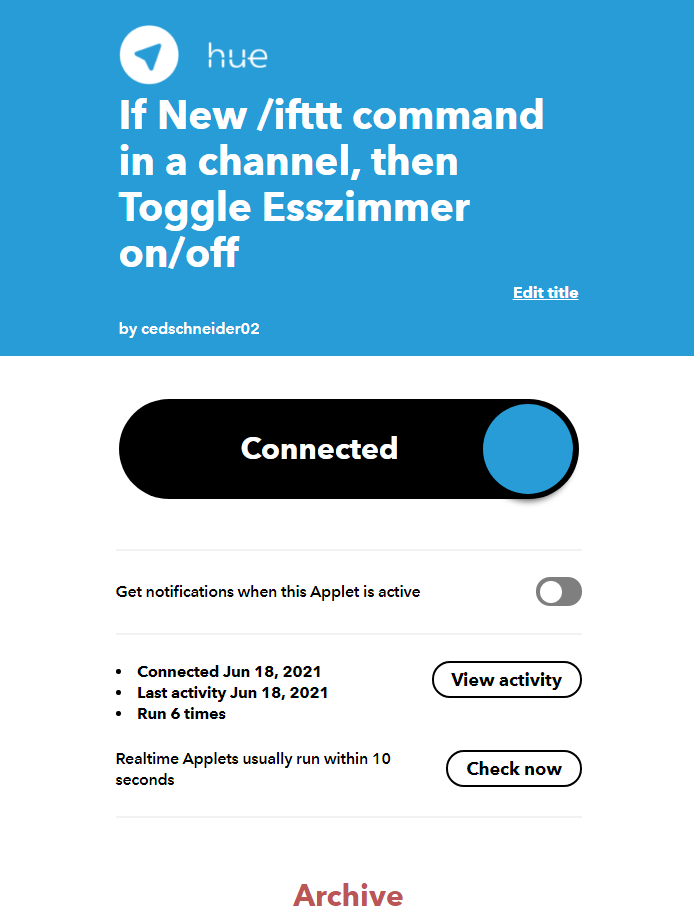
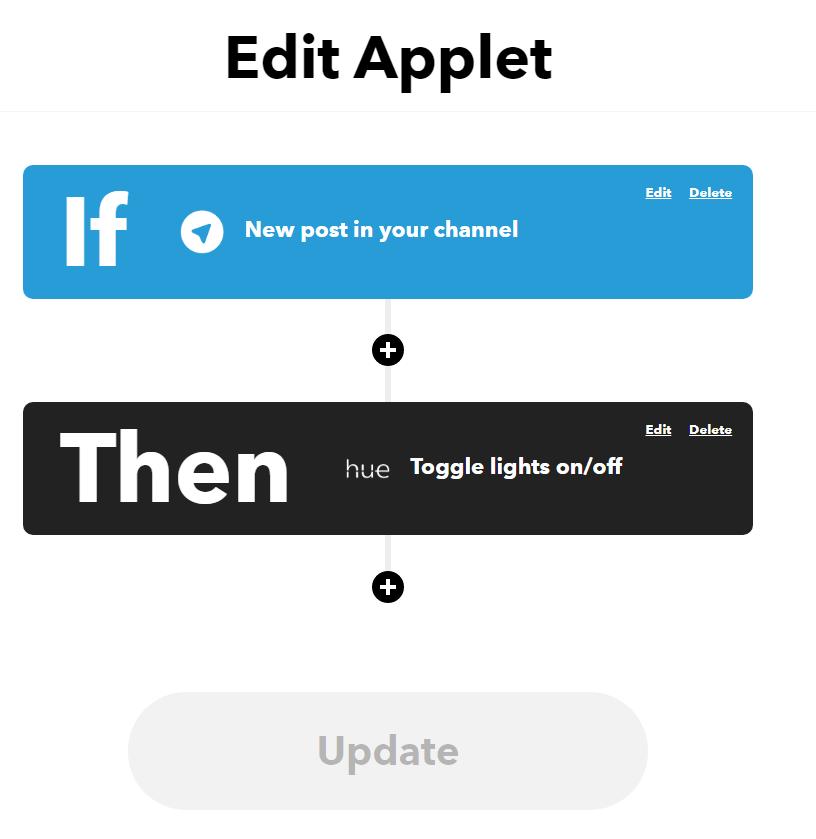
Here you can see the current settings that I have stored in IFTTT
I had no further problems implementing my use case.
Interview with further insights
In this post you got a little insight into my project. But how did I fare during the project, how did I get on with the sensors? You will find out this and more in a short interview.



Responses