Open Source Tool Grafana – An Introduction

Last modified on 11th April, 2024
In the digital age, the monitoring and display of systems and databases, both in private and in business, are very popular and almost fundamental. Therefore we would like to introduce you to the open source visualization tool Grafana in this blog post. What is Grafana, what can Grafana do and what do you need to be able to use Grafana? These questions are dealt with, among other things, below.
Another reason to present this tool is the current “IoT and Me” competition, in which participants are using Grafana in addition to the B.One Gallery and the ZENNER Datahub to map their IoT use cases.
What is Grafana?
The Grafana program is a free open source platform into which various database systems can be integrated. Grafana offers you the possibility to query and visualize data from your IoT sensors from various databases.
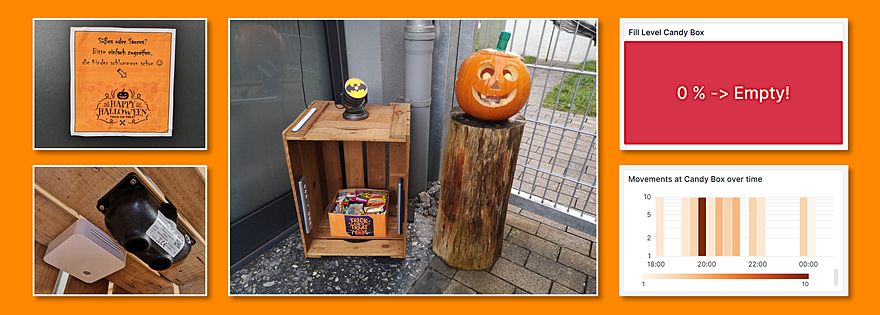
The information is displayed in so-called dashboards. Multiple dashboards with multiple panels can be created and even shared. Panels are in turn the individual representations within a dashboard. Grafana provides you with a selection of possible panels. Among other things, graphs, simple key figures, bar or pie charts and table displays are part of the Grafana standard program. Here some examples:


Depending on your requirements, you can choose between several display options. If there is still a need for additional display and design options, you can install plugins for new panels.
In addition, the period in which the data is queried can be varied. This makes it easier to see how the metrics change over time. The way in which the data is displayed and the period of time depends on the respective user or you.
In addition to the function of displaying data, there is also the option of sending alarm notifications. A certain alarm condition is stored on a graph panel, which is checked at intervals to be defined. As soon as the condition is met, an alarm notification is sent. This can be done via the following channels: email, webhooks, messengers such as Telegram, Slack and Google Hangouts as well as other tools/platforms such as e.g. Microsoft Teams. You will soon find out how exactly you can set up such an alert in another blog article.
What do you need to use Grafana?
Grafana is available either as a cloud solution or you can download and host it yourself. Both variants are free. How exactly you can install and set up Grafana locally is shown in the article “Grafana Howto: Local Installation & Setup Using Ubuntu as an Example“. In any case, the first requirement is a free account.
Before Grafana can query a data source, a successful connection between Grafana and the database is still required. It doesn’t matter which database system the data is stored in. Grafana offers a wide reservoir of compatible databases. Among them Graphite, Prometheus, OpenTSDB and InfluxDB are included in the basic program. Connections to other databases can be implemented using numerous plugins that Grafana provides in the plugin repository. You can find out exactly how you can connect such a data source/database using the example of PostgreSQL in the article “Grafana Howto: Connecting a database as a data source” and using the example of our ZENNER Datahub in another article soon.
What are the Pros/Cons of Grafana and for whom is the Tool suitable?
Due to Grafana’s functions, the programme is well suited as a monitoring tool, for example. You can monitor your own systems or databases and have numerous options for analyzing data. Grafana is suitable for private use with simpler applications, but is also an option for companies. The many compatibility options also cover a very large range of databases and visualization options. At the same time, however, these many possibilities are also a lot of input for the beginning and you need some time to orientate yourself and find your way around. However, since Grafana is an open source tool, there are many articles or forums on the Internet that have already answered many questions. Nevertheless, specific queries from the data sources are not that easy at first and require a certain level of technical knowledge. For users without such previous knowledge, a tool like the B.One Gallery is easier to use and understand, according to the motto “Plug & Play”.
As already mentioned, you will soon find more information about Grafana in other blog articles but also, for example, at https://grafana.com/grafana/.
Do you already use Grafana yourself? If yes, for what? Or do you have further questions? Tell us in the comments.
Recommend0 recommendationsPublished in Grafana, Minol ZENNER – IoT and Me, Visualization




Responses