Tag: Visualization tool
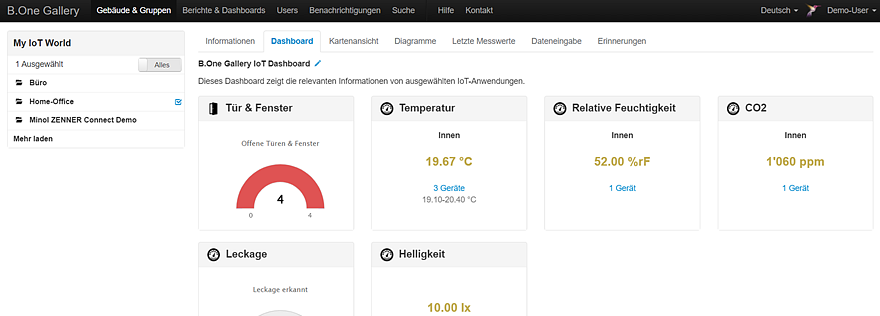
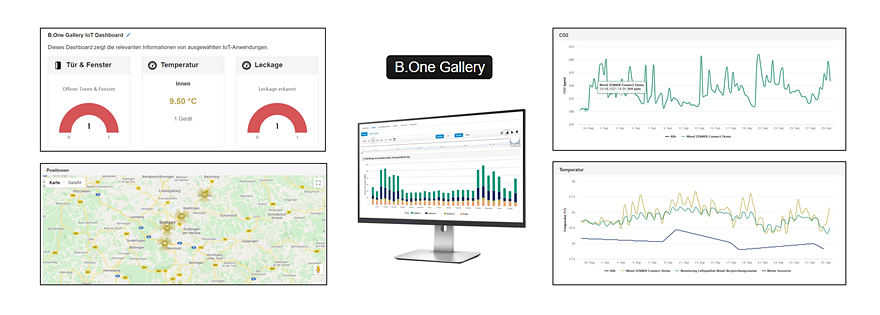
Visualization Tool B.One Gallery – An Introduction
ZENNER Datahub, ZENNERShop, B.One Gallery & Community – Context
– 📖🕓 ≈ 3 min – Last modified on March 28th, 2024 In the past and future articles you have already read a lot about the ZENNER Datahub, the B.One Gallery,…
Grafana Howto: From the ZENNER Datahub via MQTT to the InfluxDB
– 📖🕓 ≈ 5 min – Last modified on 10th April, 2024 In the last articles you have already been given a small introduction to the open source tool Grafana. It…
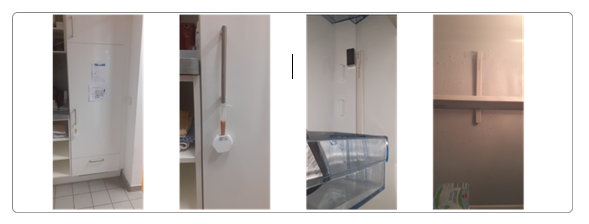
Insight into my project “IoT and Me” 2021 – refrigerator monitoring
– 📖🕓 ≈ 5 min – Last modified on 03rd May, 2024 A warm hello everyone. For those who don’t know me yet and haven’t read the blog post about the…
Open Source Tool Grafana – An Introduction
– 📖🕓 ≈ 4 min – Last modified on 11th April, 2024 In the digital age, the monitoring and display of systems and databases, both in private and in business, are…
B.One Gallery Howto: Set up Geofencing
– 📖🕓 ≈ 4 min – Last modified on 11th April, 2024 Like me, you already use the B.One Gallery visualization platform in combination with a compatible GPS tracker and would…
B.One Gallery Howto: Getting Started
– 📖🕓 ≈ 2 min – Last updated on 05.08.2024 This article is intended to simplify your start with the B.One Gallery. to the B.One Gallery By ordering your IoT GatewayPLUS…
B.One Gallery Howto: Add Sensors
– 📖🕓 ≈ 4 min – Last modified on 6th December, 2024 This how-to is intended to help you create your own sensors in the B.One Gallery using these step-by-step instructions…


